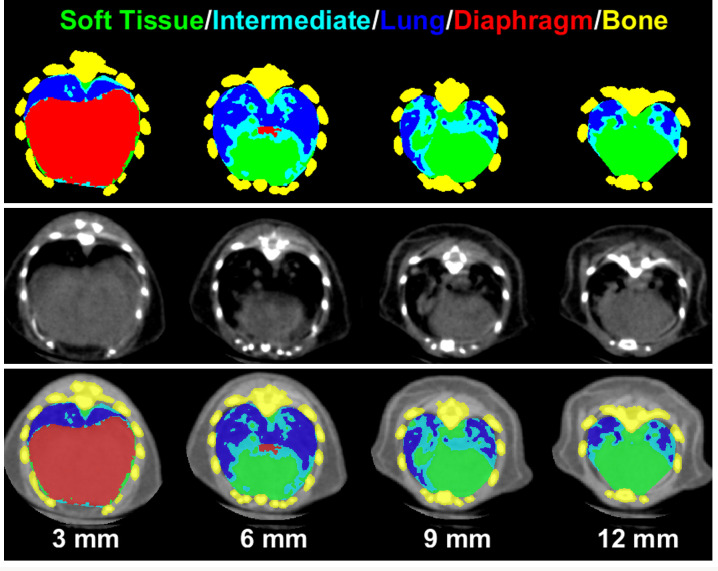
Fig 3. Representative slices of lung from a tumor-bearing mouse showing the resulting segmentation from the MLAST algorithm at various levels (3, 6, 9 and 12 mm) above the base of the diaphragm.
Top panel is MLAST only, middle panel is microCT only and the bottom panel is the overlay of MLAST and microCT images. The tissue labels for MLAST segmentation are color-coded for visual purposes: soft tissue (green), intermediate (cyan), lung (blue), diaphragm (red), and the mutlislice bone mask (yellow).

