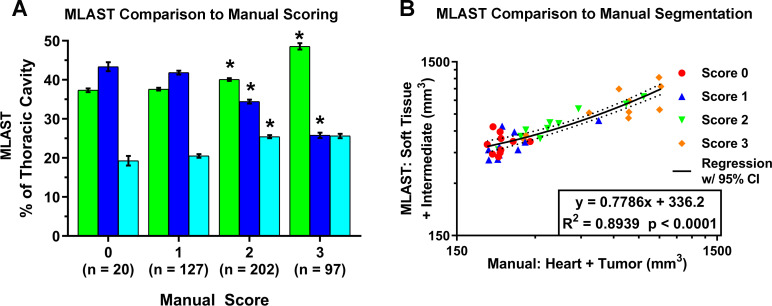
Fig 4. Comparison of MLAST with manual scoring system and manual segmentation.
(A) Results comparing MLAST values (% thoracic cavity) to manual scores on a 0–3 scale. MLAST values represent soft tissue (green bar), lung (blue bar) and intermediate density (cyan bar). The number of samples that corresponded to manual scores 0–3 is represented in Y-axis. Error bars are standard error of mean and * indicates statistical significance by Student’s t-test at a Bonferroni-corrected significance level of α = 0.0056. (B) Comparison of the three methods: manual scored samples, manually segmented volume and MLAST values. Linear regression analysis of automatically segmented thoracic tissue (intermediate + soft tissue) by MLAST vs manually segmented thoracic soft tissue (heart + tumor) volume on a log scale show good corellation.

