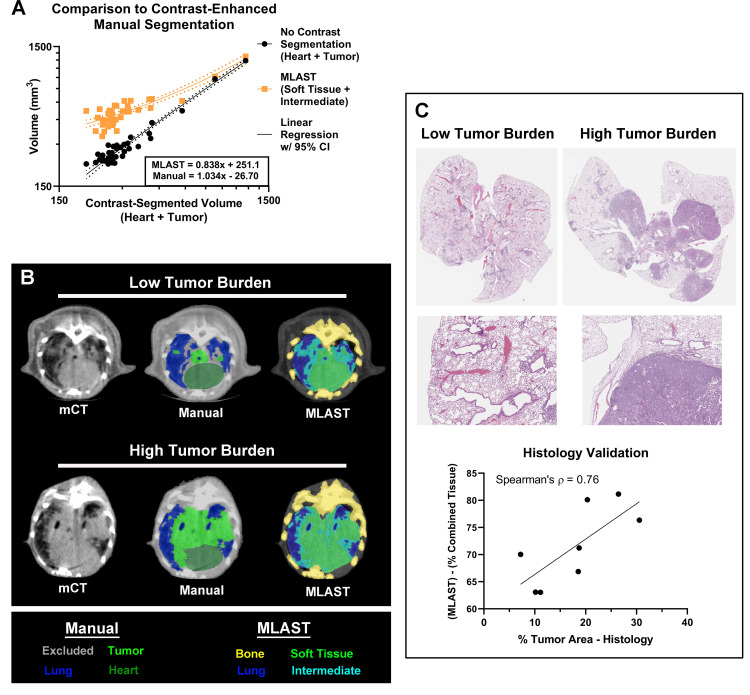
Fig 5. Comparison of MLAST using contrast-enhanced microCT imaging and histology.
(A) Validation results showing linear regression of MLAST and manually segmented volumes vs contrast-enhanced manual segmentation on a log scale. The volumes of MLAST-segmented non-contrast scans, which are made up of soft tissue and intermediate, are shown in orange. The volumes of manually segmented non-contrast scans, which are made up of heart and tumor, are shown in black. The x-axis represents the volumes of manually segmented contrast-enhanced scans, which are also made up of heart and tumor. Regression lines (solid) are shown for both results, along with a 95% Confidence Interval (dotted). (B) Representative scans with low and high tumor burden by manual and MLAST segmentation. (C) MLAST validation with histology: Representative H&E stained images with low and high tumor burden at low and high magnification. The graph shows the correlation of tumor burden evaluation by MLAST to H&E methods.

