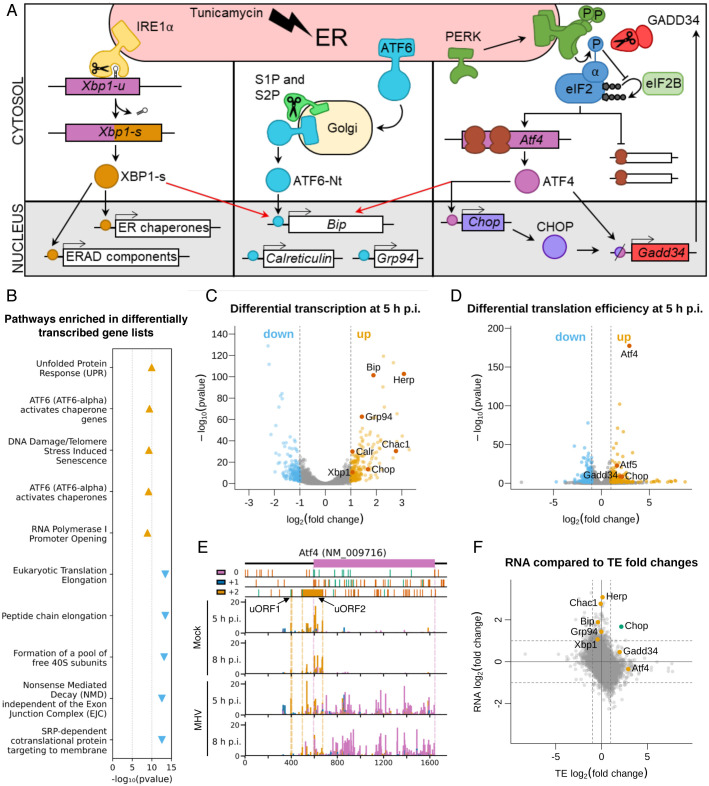
Fig 1. Ribosome profiling reveals the unfolded protein response as a key pathway in the host response to MHV-A59 infection.
(A) Schematic of the three branches of the UPR (IRE1α, ATF6, and PERK). ERAD = ER-associated protein degradation. (B) Top five most significantly enriched Reactome pathways [11] associated with the lists of transcriptionally up-regulated genes (orange triangles pointing upwards) and transcriptionally down-regulated genes (blue triangles pointing downwards), plotted according to the false discovery rate (FDR)-corrected p value of the enrichment. Full results, including pathway IDs, are in S3 Table. (C) Volcano plot showing the relative change in abundance of cellular transcripts and the FDR-corrected p value for differential expression between the mock and infected samples (n = 2 biological replicates). Grey vertical lines indicate a transcript abundance fold change of 2. Genes which have fold changes greater than this threshold and a p ≤ 0.05 value of less than 0.05 are considered significantly differentially expressed and coloured orange if up-regulated and blue if down-regulated. Selected genes are annotated in red. (D) Volcano plot showing the relative change in translation efficiency of cellular transcripts, and the FDR-corrected p value, between the mock and infected samples (n = 2 biological replicates). Colours and fold change and p value thresholds as in C. (E) Analysis of RPFs mapping to Atf4 (NCBI RefSeq mRNA NM_009716). Cells were infected with MHV-A59 or mock-infected and harvested at 5 h p.i. (libraries from replicate 2) or 8 h p.i. RPFs are plotted at the inferred position of the ribosomal P site and coloured according to phase (which position within the codon the 5′end of the read maps to: pink for 0, blue for +1, yellow for +2). The main ORF (0 frame) is shown at the top in pink, with start and stop codons in all three frames marked by green and red bars (respectively) in the three panels below. The two yellow rectangles in the +2 frame indicate the known Atf4 uORFs (the first of which is only three codons in length). Dotted lines serve as markers for the start and end of the features in their matching colour. Note that read densities are plotted as reads per million host-mRNA-mapping reads, and that bar widths were increased to 12 nt to aid visibility, and therefore overlap, and were plotted sequentially starting from the 5′ end of the transcript. (F) Plot of log2(fold changes) of translation efficiency (TE) vs transcript abundance for all genes included in both analyses. Grey lines indicate fold changes of 2. Fold changes are plotted without filtering for significant p values. Selected genes are marked: genes up-regulated predominantly by one of either transcription or TE are marked in orange (upper middle and right middle sections), and Chop, which is up-regulated at the level of both transcription and TE, is marked in green (top right section).

