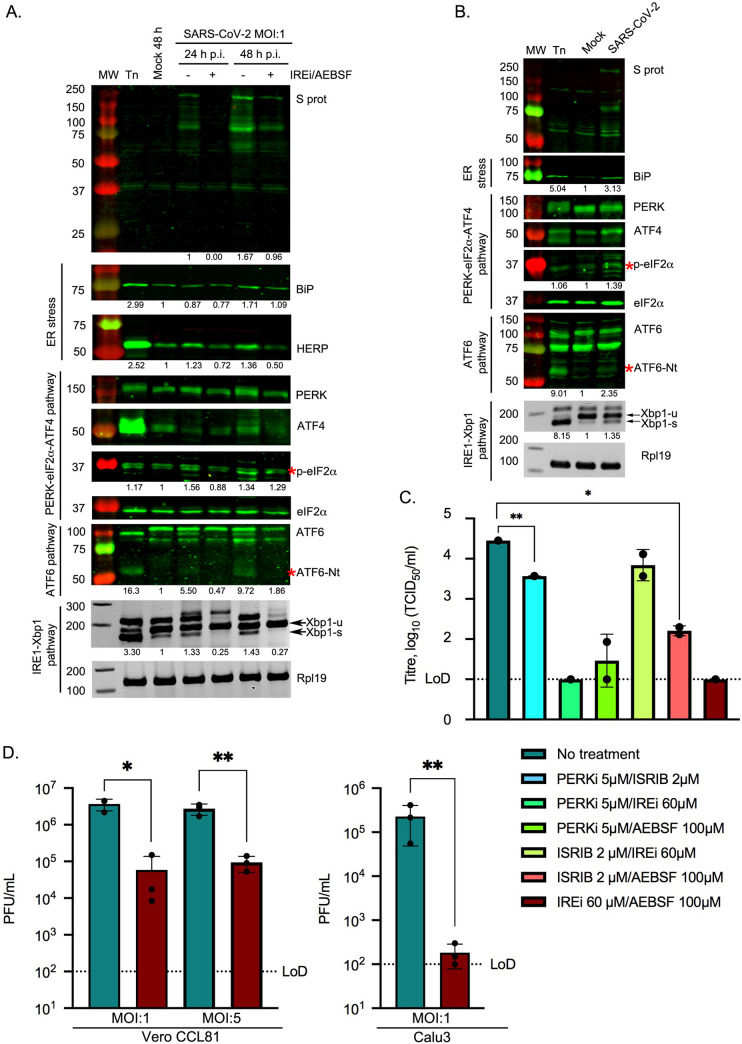
Fig 5. Induction of the UPR in SARS-CoV-2 infected cells and the effect of UPRi.
Vero CCL81 cells (A) or Calu3 cells (B) were incubated in the presence of tunicamycin (2 μg/ml) or infected with SARS-CoV-2 (MOI 1). Infected Vero CCL81 cells were treated with 60 μM IREi and 100 μM AEBSF immediately after the virus adsorption period and inhibitors were maintained in the medium until cells were harvested 24 and 48 h later. Infected Calu3 cells were harvested at 24 h p.i. (A-B) Western blot analysis (upper) of SARS-CoV-2 S, BiP, HERP, PERK, ATF4, p-eIF2α and ATF6 proteins from cell lysates of Vero CCL81 cells (A) or Calu3 (B) infected cells. The specific p-eIF2α and ATF6-Nt bands are indicated by red asterisks. Protein band quantifications, normalised by eIF2α as a loading control and given relative to the mock, are provided below the respective immunoblots. RT-PCR analysis of XBP1-u and XBP1-s mRNAs (lower), performed as described in Fig 2D. Immunoblots and agarose gels are representative of three biological replicates. (C) TCID50 assays were performed with serial dilutions of the supernatant containing released virions from Caco2 cells infected with SARS-CoV-2 (MOI 0.01) for 48 h in the presence or absence of the indicated UPRi combinations. (D) Plaque assays were performed with serial dilutions of the supernatant containing released virions from Vero CCL81 or Calu3 cells infected with SARS-CoV-2 (MOI 1 and MOI 5) for 24 h in the presence or absence of 60 μM IREi and 100 μM AEBSF. Values show the mean averages of the titration of three biological replicates. Error bars represent standard errors. All t-tests were two-tailed and did not assume equal variance for the two populations being compared (*p < 0.05, ** p < 0.01). Replicates with titres below the limit of detection (LoD) were excluded from t-tests, precluding some conditions from statistical assessment.

