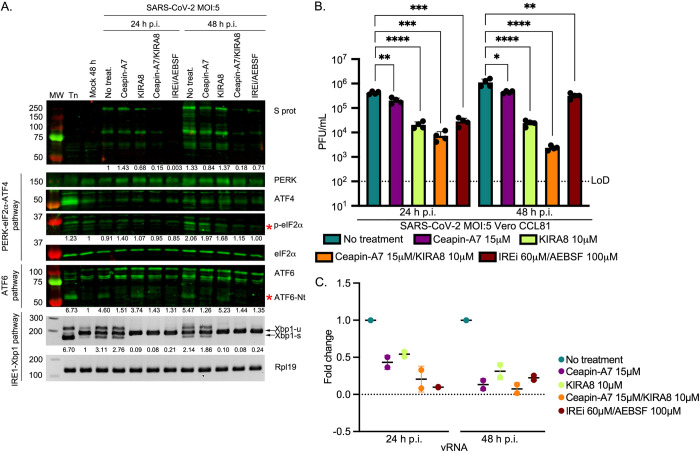
Fig 6. Effect of specific inhibition of IRE1α and ATF6 pathways on SARS-CoV-2 replication.
Vero CCL81 cells were incubated in the presence of tunicamycin (2 μg/ml) or infected with SARS-CoV-2 (MOI 5) and treated with 15 μM Ceapin-A7 and 10 μM KIRA8 as individual treatments or in combination. The inhibitors were added to the cells immediately after the virus adsorption period and maintained in the medium for 24 or 48 h. (A) Western blot analysis (upper) of SARS-CoV-2 S, PERK, ATF4, p-eIF2α and ATF6. The specific p-eIF2α and ATF6-Nt bands are indicated by red asterisks. Protein band quantifications, normalised by eIF2α as a loading control and given relative to the mock, are provided below the respective immunoblots. RT-PCR analysis of XBP1-u and XBP1-s mRNAs (lower), performed as described in Fig 2D. Immunoblots and agarose gels are representative of three biological replicates. (B) Plaque assays were performed with serial dilutions of the supernatant containing released virions at 24 and 48 h p.i. Values show the mean averages of the titration of four biological replicates. Error bars represent standard errors. All p-values are from comparisons with the respective untreated control, with *p < 0.05, ** p < 0.01, *** p < 0.001 and **** p < 0.0001. (C) RT-qPCR of vRNA from two biological replicates of Vero CCL81 cells infected and treated as described above. Data are normalised as described in Fig 2B.

