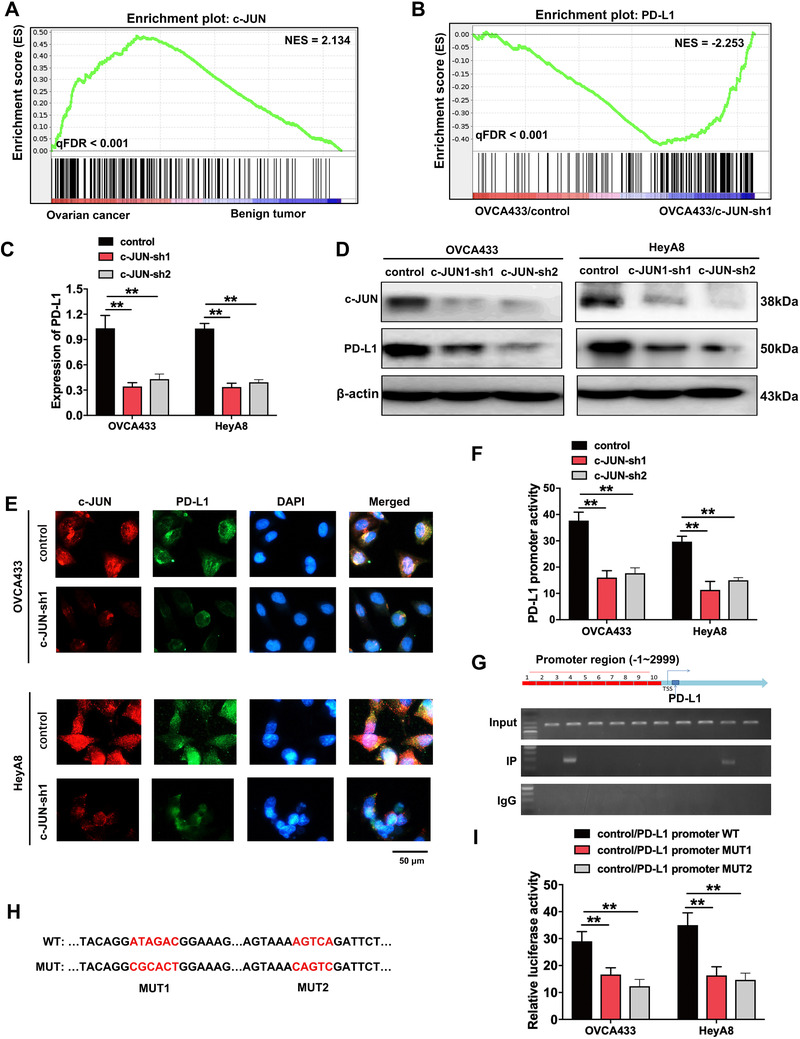
FIGURE 5.

PD‐L1 is the downstream targeting molecule of c‐JUN, which is highly expressed in ovarian cancer tissues. (A) GSEA analysis was performed using ovarian cancer and benign tumor tissues. A gene signature was defined as a gene with significant expression changes. (B) GSEA analysis was performed using c‐JUN‐knockdown and control cells (OVCA433/c‐JUN‐sh1 and OVCA433/control). A gene signature was defined as a gene with significant expression changes. (C‐D) qRT‐PCR (C) and Western blotting (D) analysis of c‐JUN and PD‐L1. β‐actin was used as a loading control. (E) Immunofluorescence assay demonstrates the relation of c‐JUN and PD‐L1. (F) PD‐L1 promoter activity is affected by c‐JUN silencing. (G) qRT‐PCR results of ChIP analysis shows that c‐JUN is bound to the PD‐L1 gene promoter region. (H) The map of c‐JUN‐binding sits in the promoter region of PD‐L1. (I) Luciferase reporter assay was used for the detection of c‐JUN‐mutant sites in the promoter region of PD‐L1. **P < 0.01. Abbreviations: PD‐L1: programmed cell death‐ligand 1; GSEA: gene set enrichment analysis; ES: enrichment score; NES: normalized enrichment score; FDR: false discovery rate; c‐JUN‐sh1/2: c‐JUN short‐hairpin RNA 1/2; qRT‐PCR: quantitative real‐time polymerase chain reaction; ChIP: chromatin immunoprecipitation; WT: wide type; MUT: mutant
