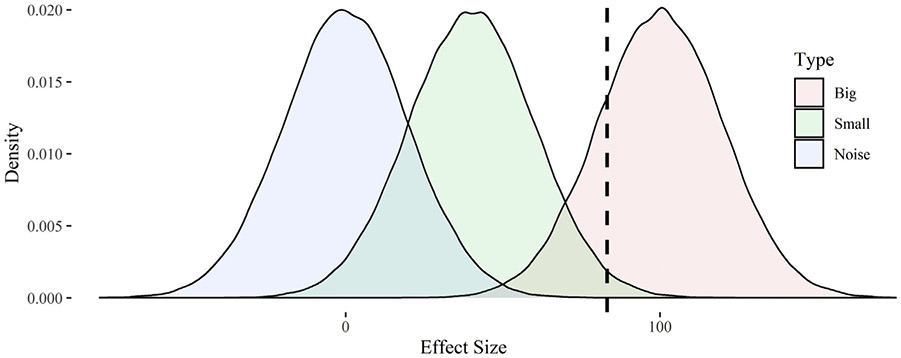
Fig –
Density plots for the effects of simulated surgical interventions. Notes: The chart displays densities for the effects of simulated surgical interventions with big effects (μ = 100, σ = 20), small effects (μ = 100, σ = 20), or an ineffective intervention with noise-only (μ = 0, σ = 20). The dashed line represents the rejection region under 80% statistical power; observed effects to the right of this line are expected to be statistically significant.

