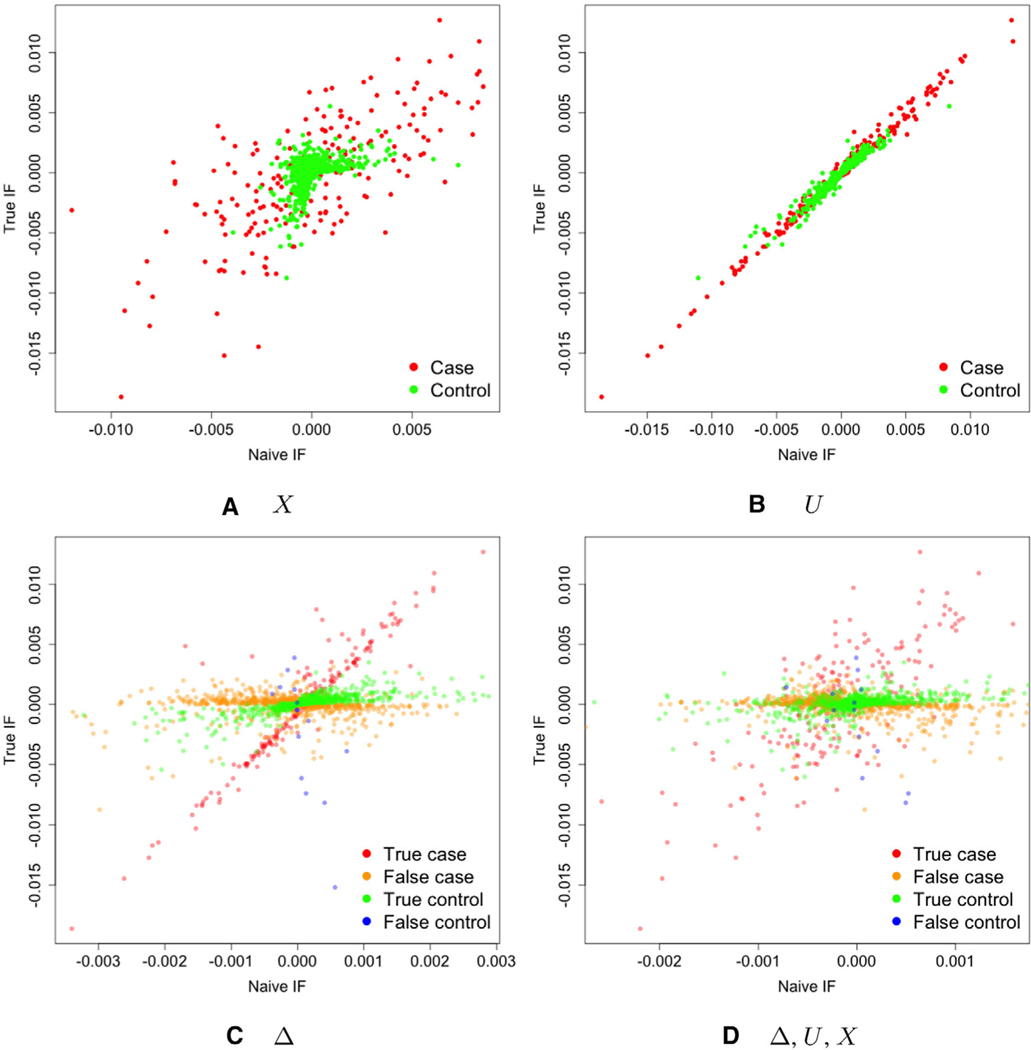
FIGURE 1.
Plots of the true influence function against the error-prone version with the variables subject to measurement error noted in the graph subtitle. For example, (A) displays against . Univariate and normally distributed X and Z were generated. Survival times were generated from an exponential distribution with rate , where , and , with 90% independent censoring. The error was generated as , and , where were normally distributed with , variances , and

