
Figure 4.
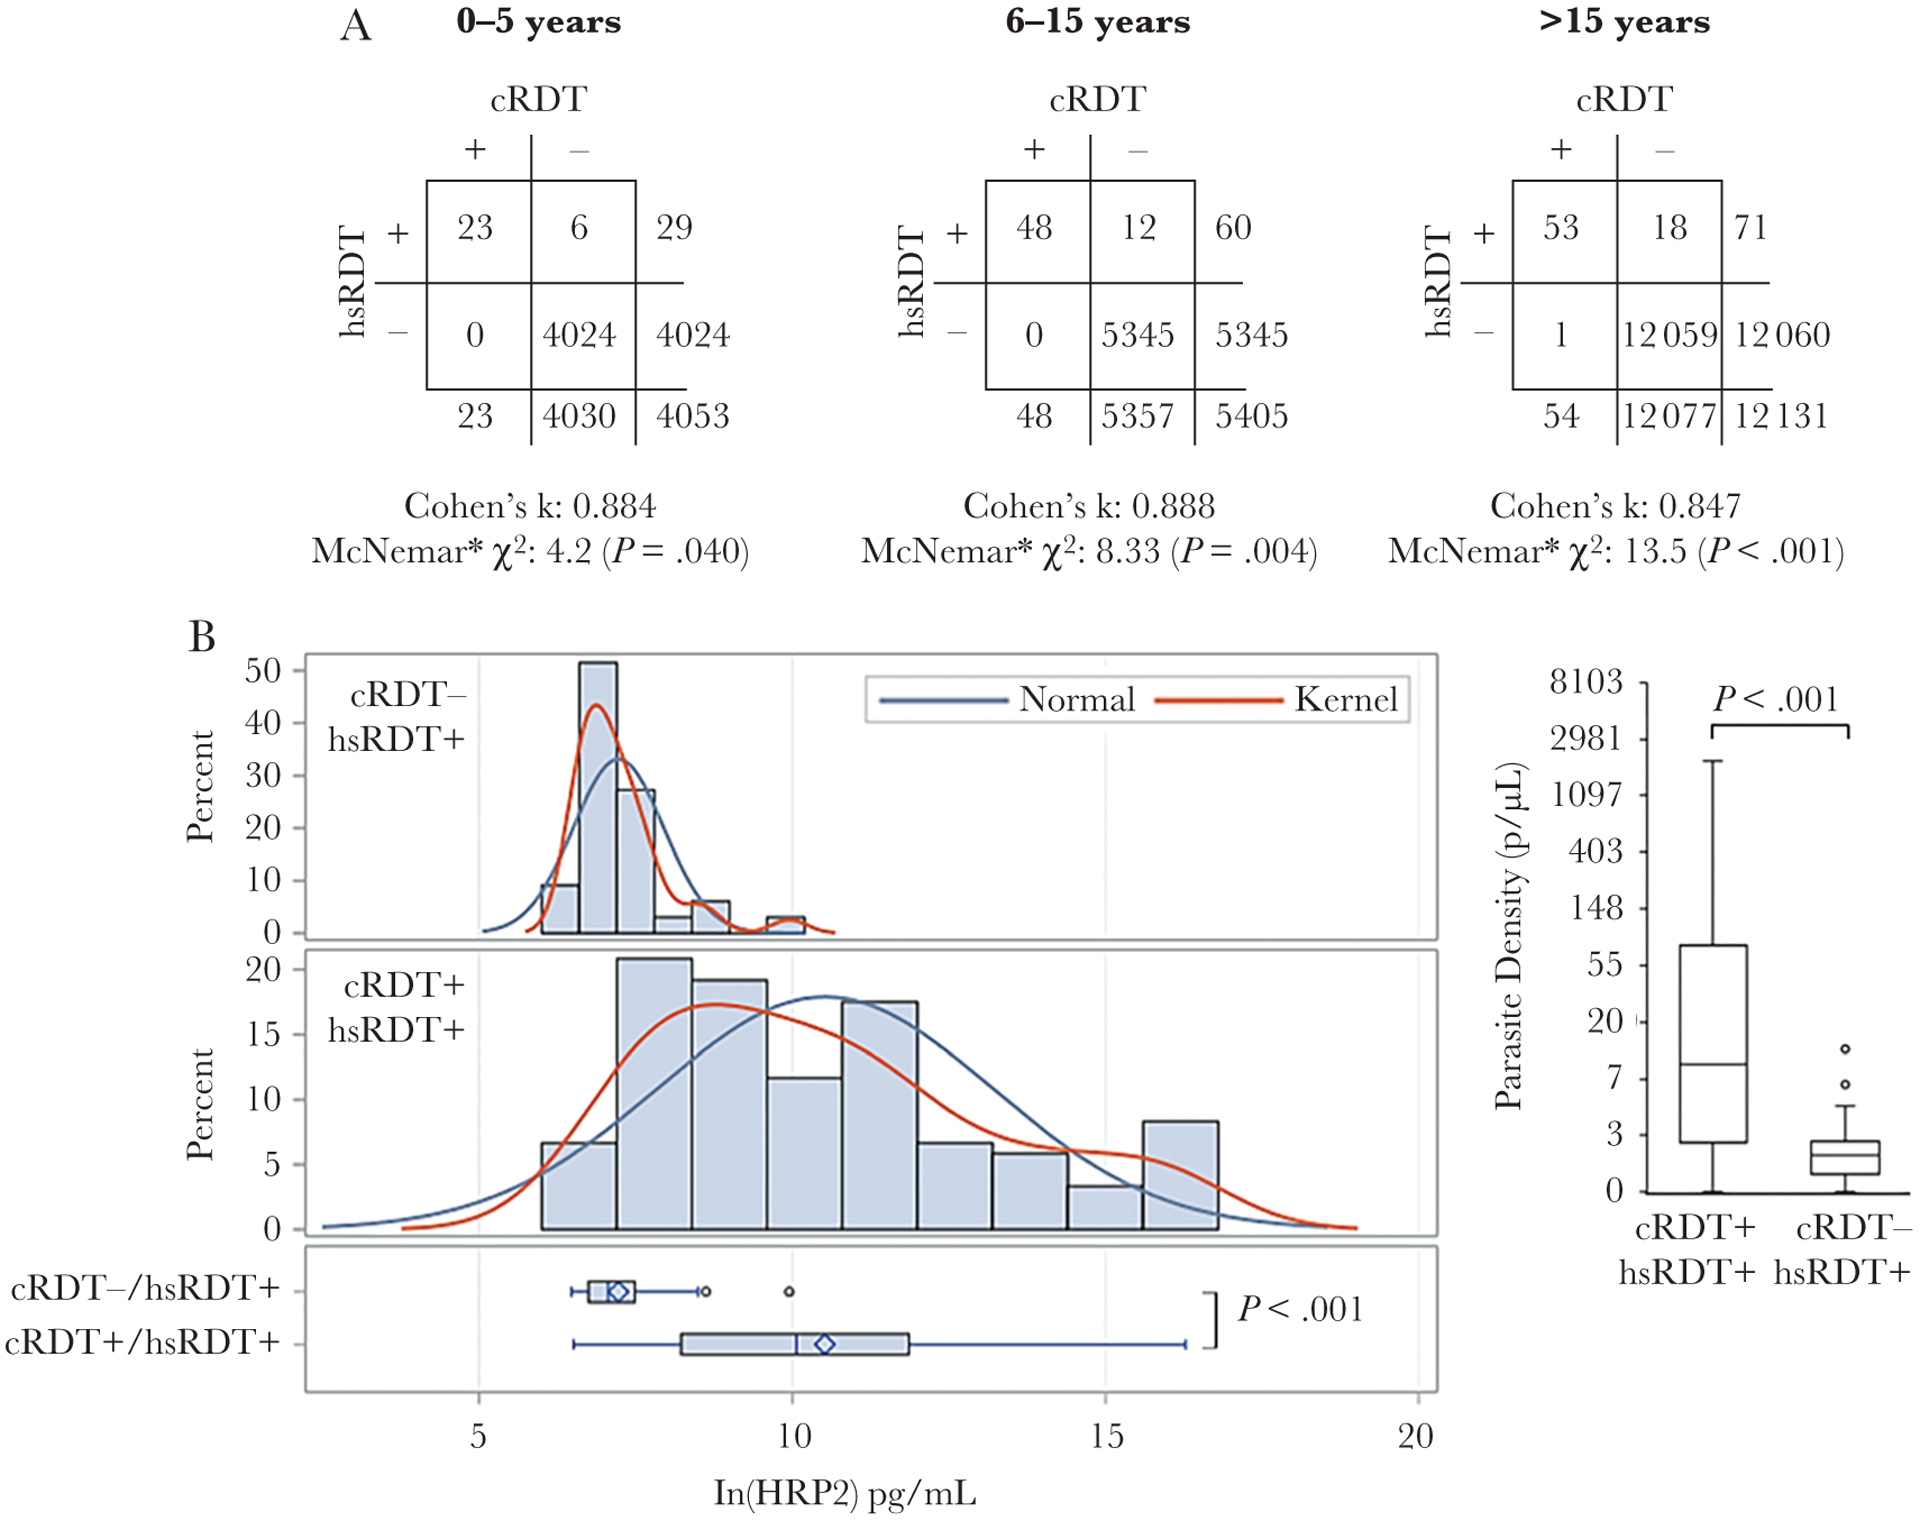
Concordance of conventional rapid diagnostic test (cRDT) and high-sensitivity rapid diagnostic test (hsRDT) for large household-based survey in Artibonite. A, Two-by-two tables are separated by age categories: 0–5, 6–15, and >15 years of age, with estimates for Cohen κ statistic for agreement between the 2 types of RDTs. *McNemar test to indicate statistical significance of discordant test results between the 2 RDTs was modified to adjust for low numbers of discordant results as described in the Methods. Differences in histidine-rich protein 2 (HRP2) antigen levels (B) and photo-induced electron transfer polymerase chain reaction–estimated parasite density for blood samples from persons testing positive for both RDTs, or high-sensitivity RDT (hsRDT) only. Antigen levels are log-transformed and normal and kernel distributions overlaid. Boxes are 25% and 75% percentile with the horizontal line displaying the median. Whiskers display minimum and maximum values within 1.5 interquartile range and circles are outliers beyond this range.