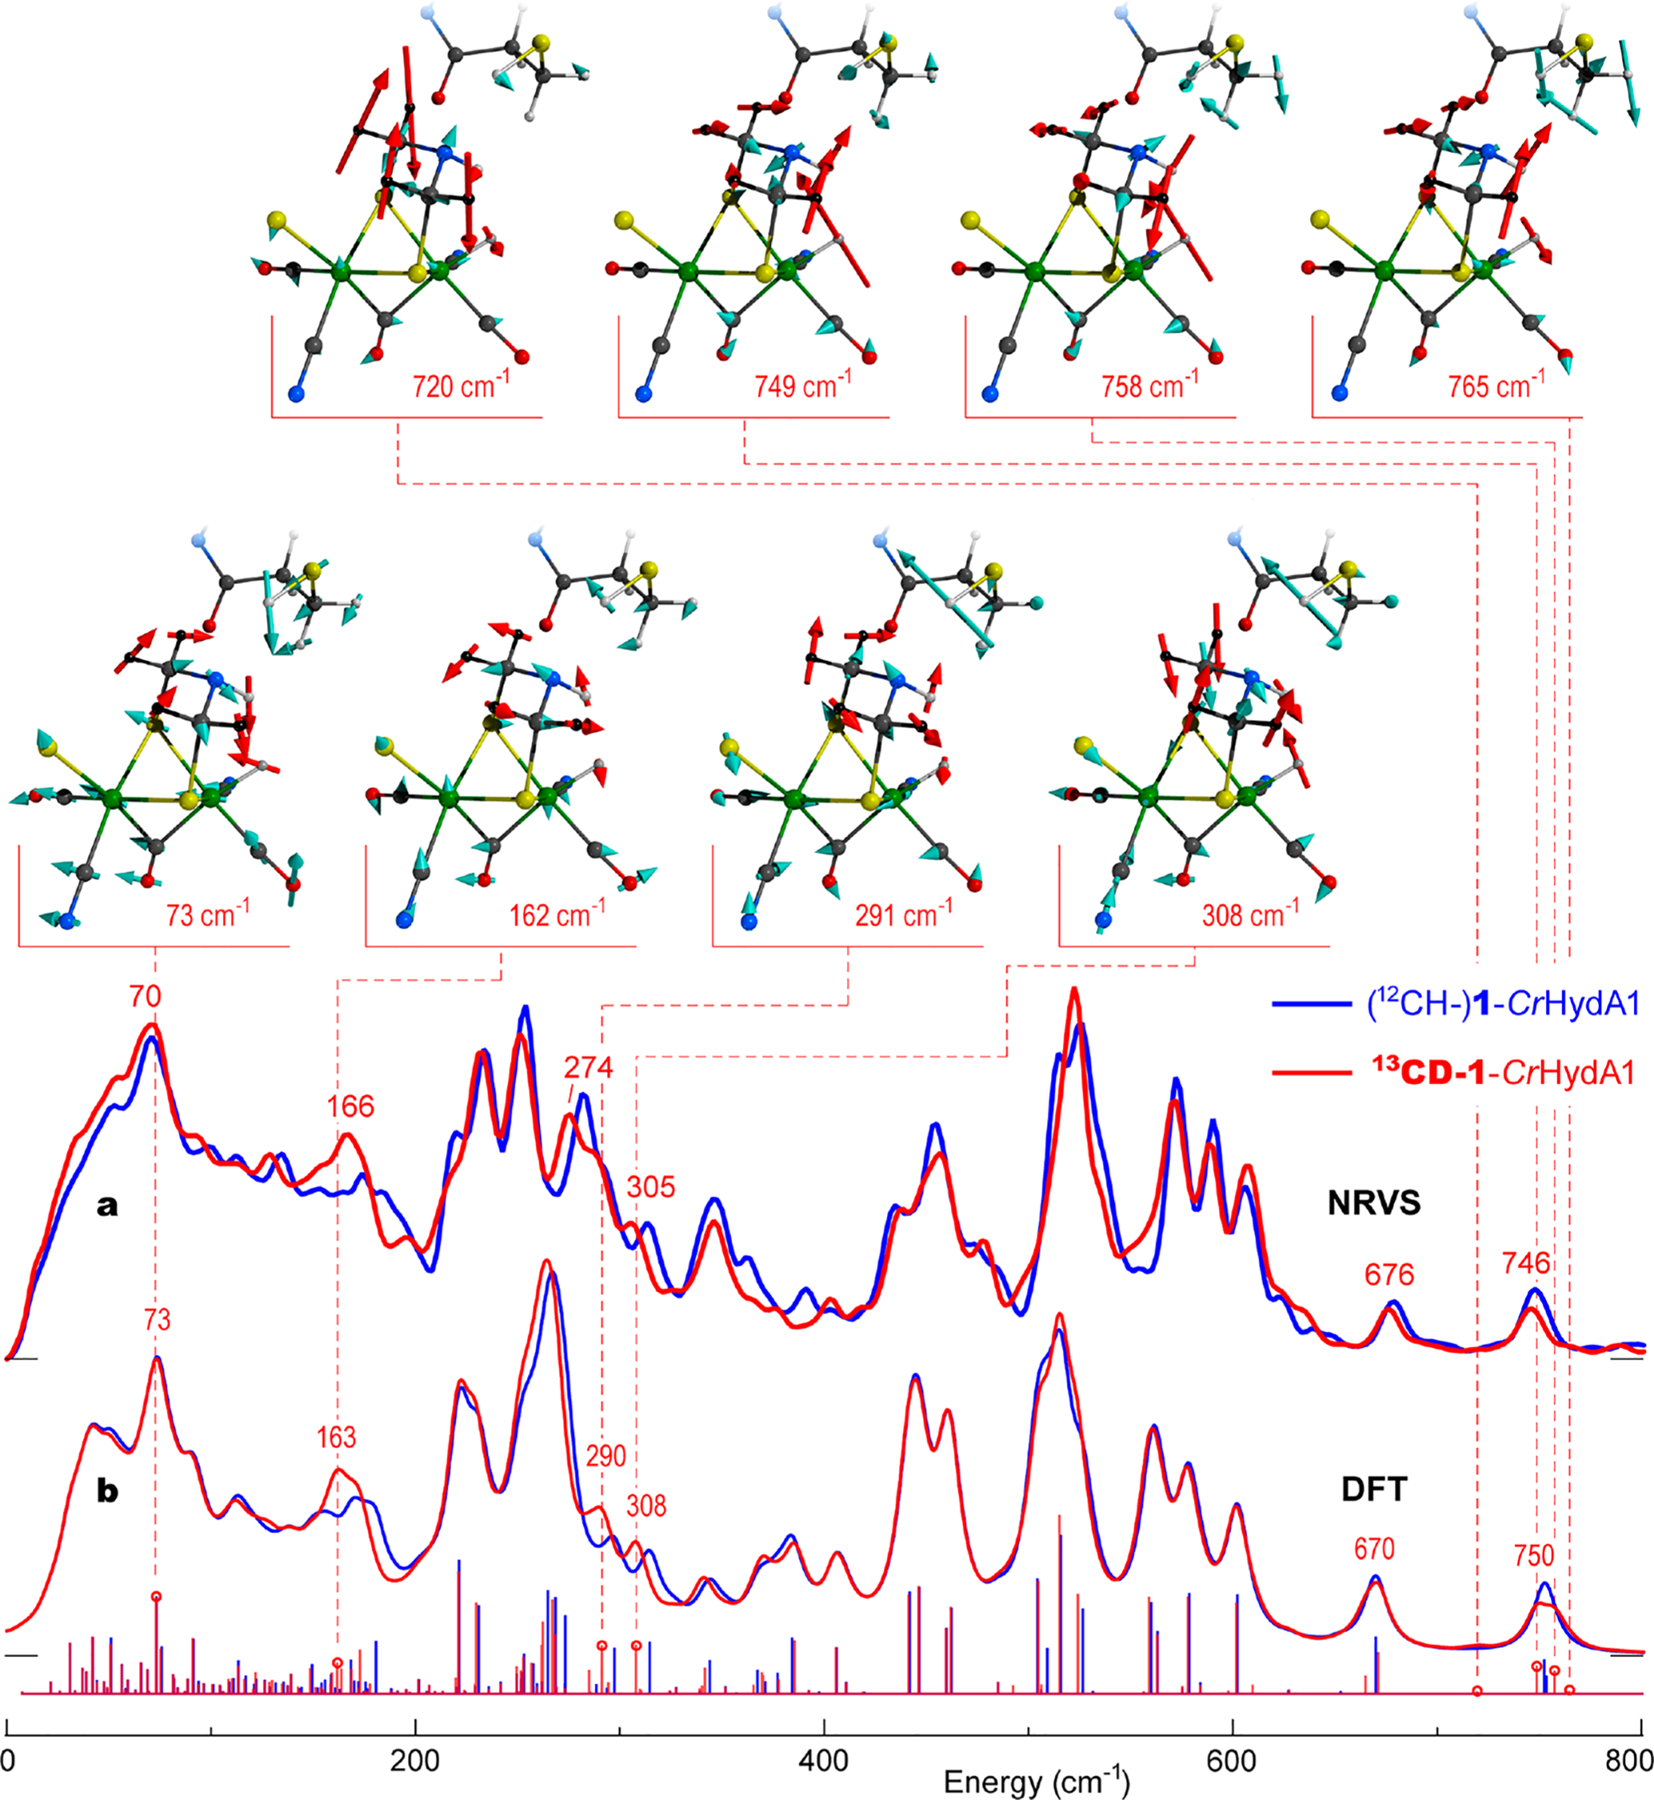
Figure 3.

57Fe-PVDOS for the Hhyd state isotopologues 1-CrHydA1 (blue) vs 13CD-1-CrHydA1 (red) from (a) an NRVS experiment and (b) DFT calculations. Sticks correspond to individual DFT normal mode energies and intensities before broadening. For 13CD-1-CrHydA1, important band positions are labeled, and atomic motions in selected normal modes are shown. Only the [2Fe]H and C169 fragments of the DFT model are shown with the methylene, Hh, and HADT hydrogen nuclei displacements indicated by red arrows.
