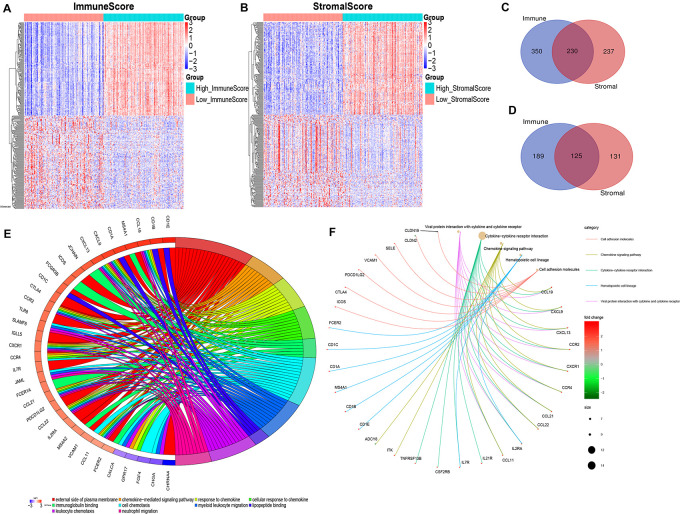
FIGURE 2.
Identification and functional enrichment of differentially expressed genes. (A) Heatmap for DEGs generated by comparison of the high ImmuneScore group with the low ImmuneScore group. Rows and columns represent DEGs and samples, respectively. Significant DEGs were determined with FDR < 0.05 and | fold-change| > 1.5 after log2 transformation. (B) Heatmap for DEGs in StromalScore, similar with (A). (C,D) Venn plots showing common upregulated and downregulated DEGs shared by ImmuneScore and StromalScore. (E) GOChord plot of GO enrichment analysis for common DEGs showing enriched GO terms and corresponding genes. The significance level was set to be with both FDR and q < 0.05. (F) Cnetplot of KEGG enrichment analysis for common DEGs showing enriched KEGG terms and corresponding genes. The significance level was set to be with both FDR and q < 0.05.

