
FIGURE 12.
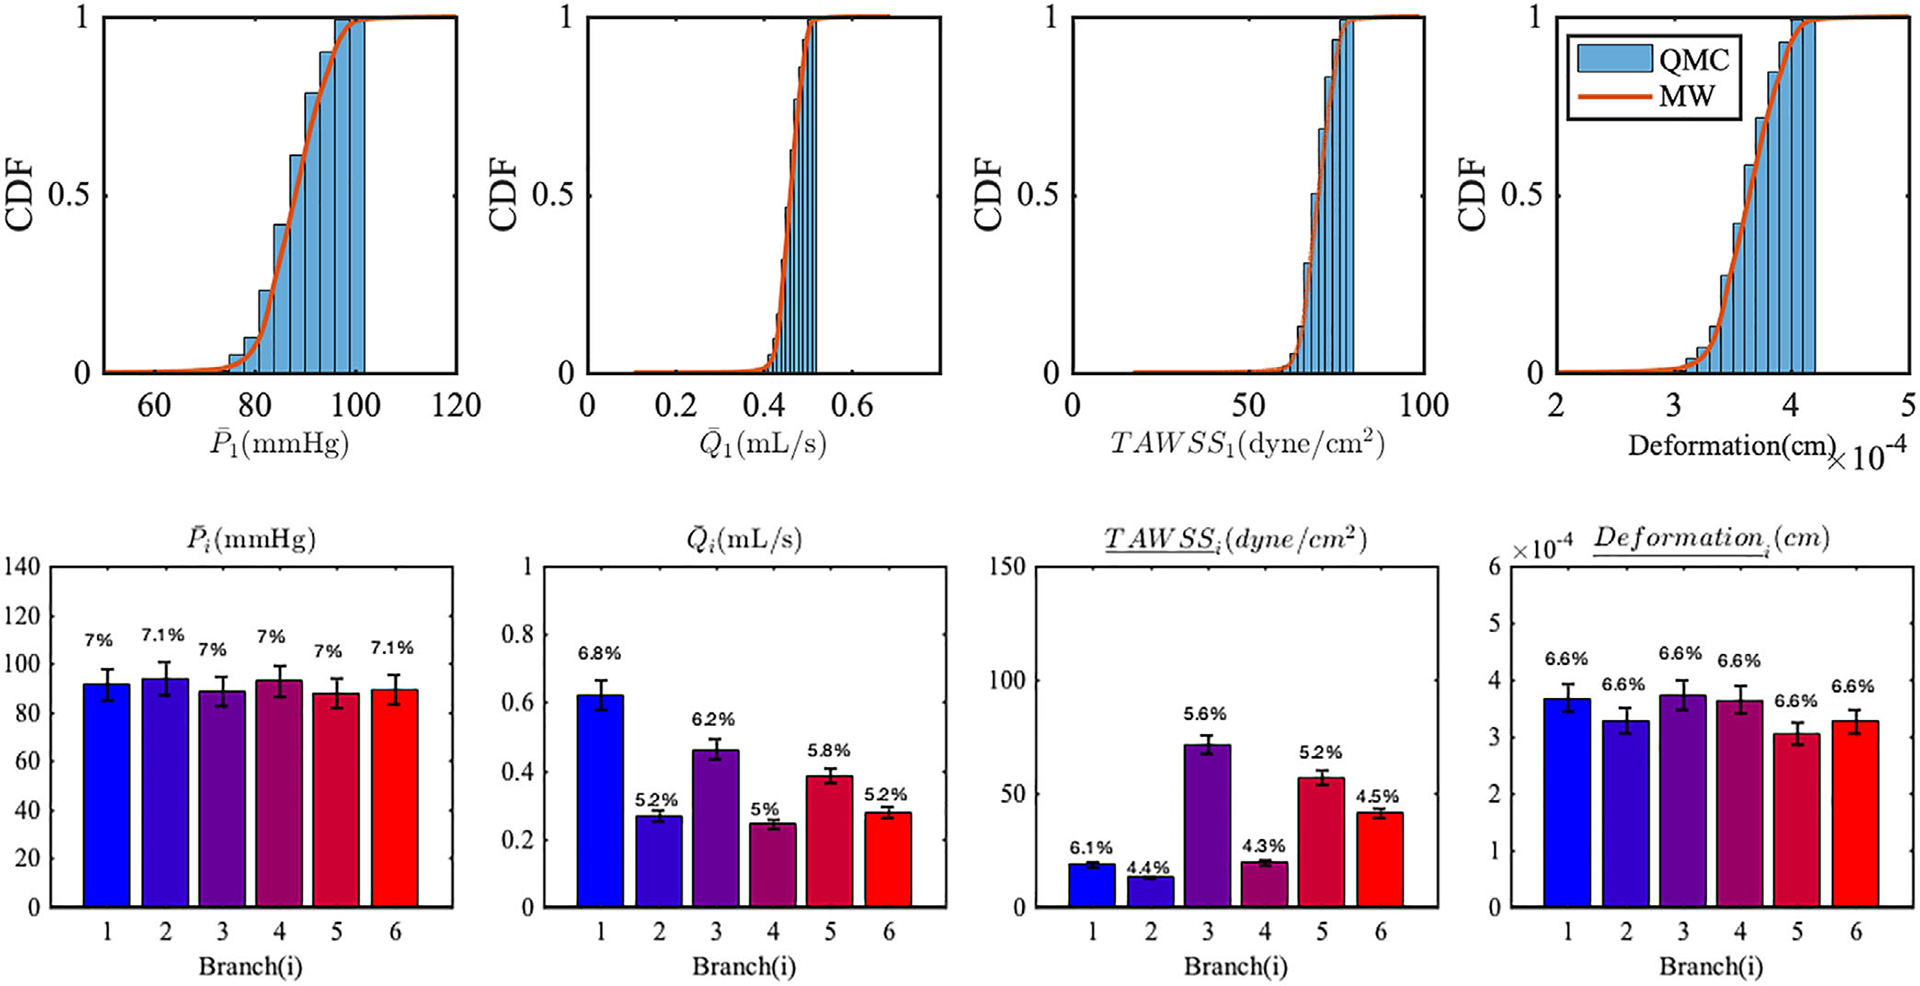
(Top) CDF estimates of QoIs in LAD obtained from QMC and MW approach. (bottom) Mean and SD of QoIs resulting from uncertainty in the inlet pressure time history. The error bars represent two SD. The coefficients of variation are reported at the top of each bar. Over bar notation on QoIs means time-average and underline notation means the spatial average