. 2021 Jun 8;10:e60554. doi: 10.7554/eLife.60554

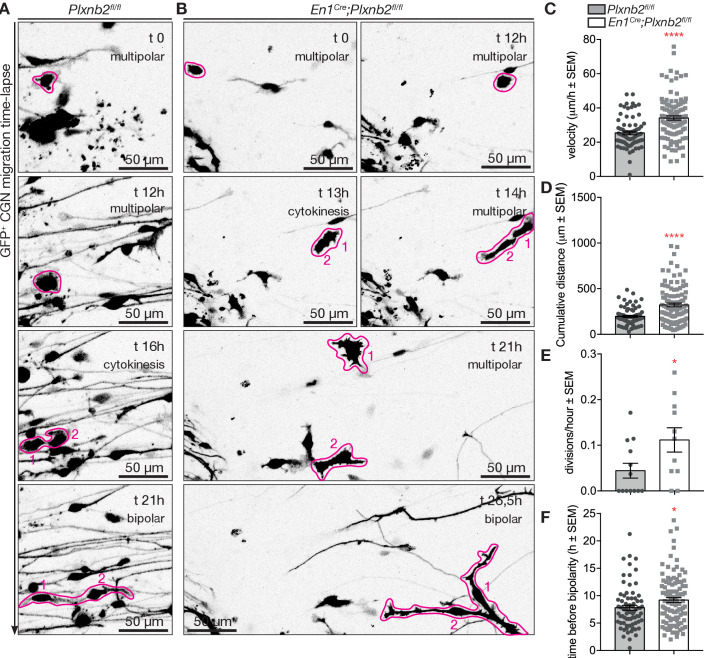
Figure 10. Aberrant CGN (precursor) motility before and after division in Plxnb2 mutant explants.

(A, B) Time-lapse confocal imaging series (21 hr) of GFP+ multipolar CGNs in control (A) and Plxnb2 mutant explants at DIV1. (A) In a control, a multipolar cell (outlined in pink at t 0 hr) divides (cytokinesis, t 16 hr) to give rise to two daughter cells (1 and 2) which later adopt a bipolar morphology. (B) In a Plxnb2 mutant, multipolar cells (outlined in pink) are more motile and the transition to the bipolar stage is delayed. Scale bars 50 μm. (C–F) Quantifications of multipolar cell velocity, cumulative distance before cytokinesis, time that daughter cells take to become bipolar after cytokinesis, and the amount of visible divisions of GFP+ cells per hour. Error bars represent SEM. 75 ctl and 107 mut multipolar GFP+ CGNs were tracked from 13 ctl and 11 mutant explants from five different experimental repeats. (C) Velocity ctl 25.41 ± 1.04 μm/h vs. mut 34.11 ± 1.24 μm/h, MWU(2279) p<0.0001 (Figure 10—source data 1). (D) Cumulative distance ctl 196.3 ± 11.08 μm vs. mut 321.8 ± 19.73 μm, MWU(2516) p<0.0001 (Figure 10—source data 1). (E) Time before bipolarity ctl 7.80 ± 0.45 hr vs. 9.21 ± 0.44 hr, MWU(3254) p=0.0298 (Figure 10—source data 1). (F) Divisions per hour ctl 0.044 ± 0.016 vs. mut 0.11 ± 0.027, MWU(36) p=0.034. (Figure 10—source data 1).

Figure 10—source data 1. EGL explants: live imaging of multipolar CGNs.

Figure 10.

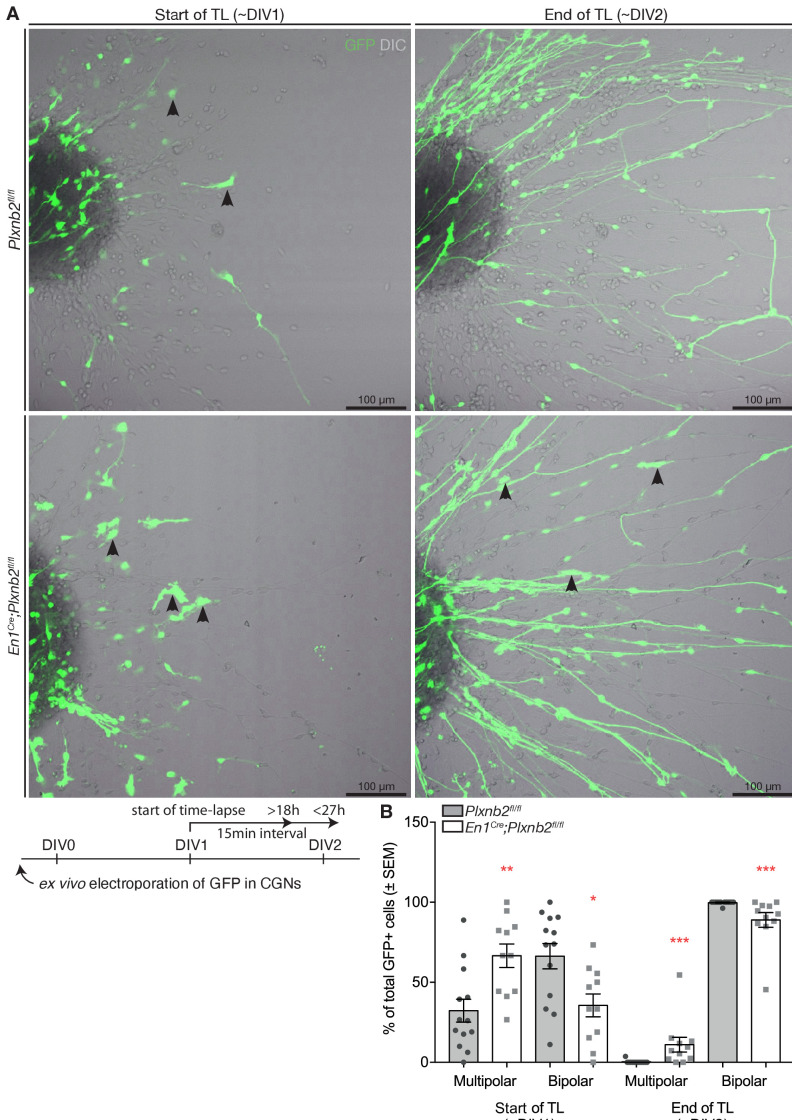
Figure 10—figure supplement 1. Quantification of the distribution of multi- and bipolar CGNs during time-lapse.

Figure 10—figure supplement 1.

(A) Still images at the beginning (t = 0 hr, DIV1) and at the end (t = 18 hr, DIV2) of a time-lapse imaging series of migrating GFP+ CGNs in EGL explants. Plxnb2 mutant explants show relatively more multipolar-shaped CGNs (arrowheads) compared to controls. After 18 hr of imaging, when all CGNs that exited control explants turned bipolar, mutant explants still contain multipolar CGNs (arrowheads). Schematic shows experimental design. Fifteen min time-lapse recordings were performed from 24 hr (DIV1) after plating (t 0), and continued for 18–27 hr. (B) Quantification of the percentages of multipolar- or bipolar-shaped GFP+ cells at the beginning and at the end of time-lapse. Beginning of time-lapse (DIV1) multipolar ctl 32.28 ± 7.17% vs. mut 66.61 ± 7.33%, MWU(20.5) p=0.002; bipolar ctl 66.27 ± 7.89% vs. mut 35.56 ± 7.12%, MWU(28.5) p=0.0111. End of time-lapse (DIV2) multipolar ctl 0.28 ± 0.28% vs. mut 11.04 ± 4.63%, MWU(16) p=0.0001; bipolar ctl 99.72 ± 0.28% vs. mut 88.96 ± 4.63%, MWU(16) p=0.0001. 745 ctl and 414 mut GFP+ cells were counted at the end of recordings from 13 ctl and 11 mut explants from five experimental repeats. (Figure 10—figure supplement 1—source data 1) Scale bars: 100 μm.
Figure 10—figure supplement 1—source data 1. Morphology of CGNs during live imaging.