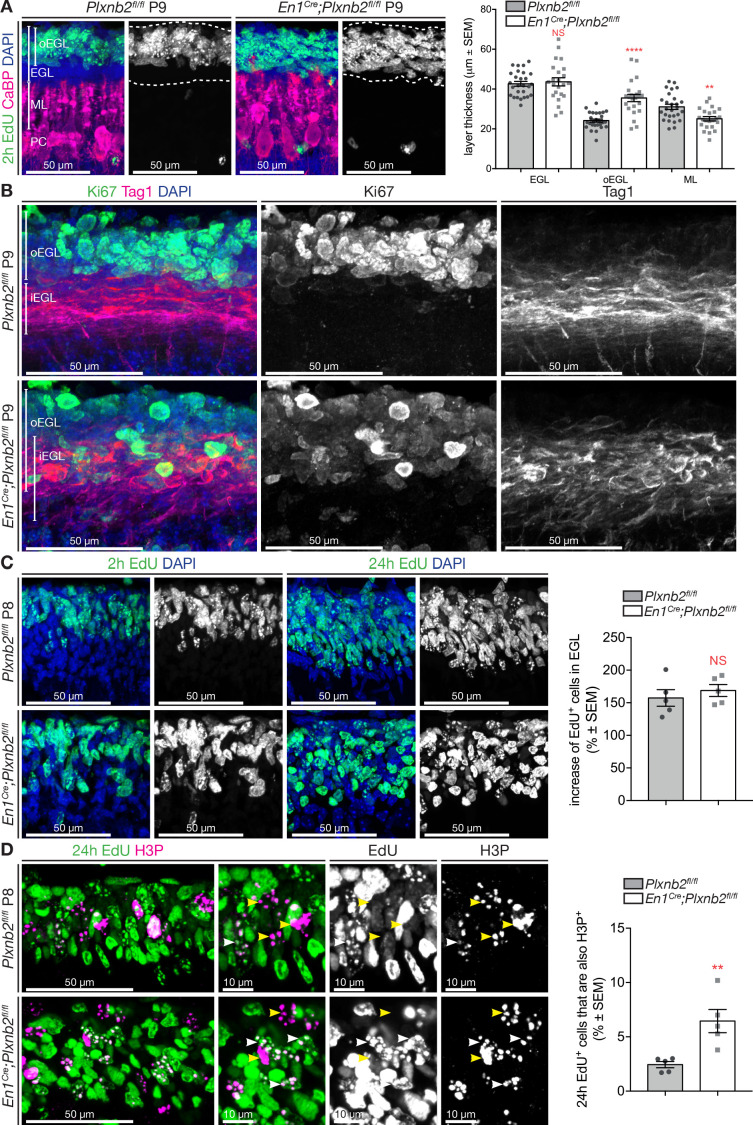
Figure 4. Proliferating CGNs intermingle with migrating CGNs and have a longer cell-cycle.
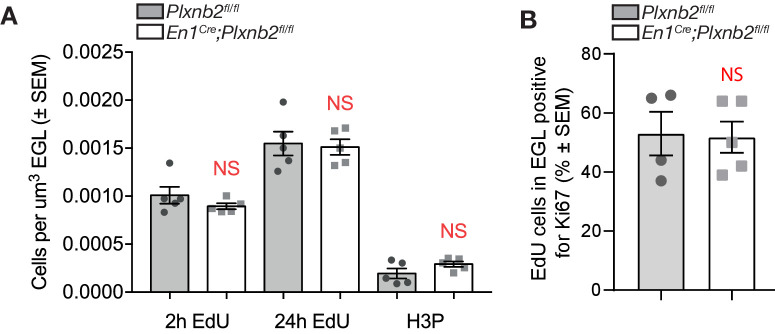
(A) Coronal sections of P9 cerebella of Plxnb2fl/fl control and En1Cre;Plxnb2fl/fl littermates injected with EdU 2 hr before perfusion. EdU labels proliferating CGN precursors and Calbindin (CaBP) immunostaining labels Purkinje cells. Sections were counterstained with DAPI. In control, proliferating CGNs (EdU+) are restricted to the outer layer of the EGL (oEGL). In Plxnb2 mutant, EdU+ CGN precursors are found throughout the EGL. The developing molecular layer, containing CaBP+Purkinje cell dendrites, is thinner in Plxnb2 mutant. The graph shows the quantification of the thickness of the EGL, oEGL, and molecular layer (ML). Error bars represent SEM. EGL: 42.63 ± 1.19 μm in ctl vs. 43.62 ± 2.04 μm, in mut, MWU(295) p=0.77, NS: not significant. oEGL 24.78 ± 0.42 μm in ctl vs. 35.32 ± 0.76 μm in mut. MWU(70) p<0.0001. ML: 32.04 ± 0.71 μm in ctl vs. 27.44 ± 0.64 μm in mut. MWU(159) p=0.027. (Figure 4—source data 1) (B) Coronal sections of P9 cerebella from Plxnb2fl/fl control and En1Cre;Plxnb2fl/fl littermates, immunostained for Ki67 and Tag1. Ki67 labels proliferating CGN precursors in the oEGL and Tag1 postmitotic CGNs that migrate tangentially in the inner EGL (iEGL). These two populations of precursors and postmitotic neurons are strictly separated in controls, whereas they intermingle in Plxnb2 mutants. (C) Sagittal sections of P8 cerebella from Plxnb2fl/fl and En1Cre;Plxnb2fl/fl littermates injected with EdU 2 hr, or 24 hr prior to fixation. EdU+ cells were counted and averaged from three sections per animal from five ctl and five mut animals. No difference in the production of new CGNs between 2 and 24 hr of EdU were observed. Graph shows the percentage of EdU+ cells in the EGL after 24 hr compared to 2 hr (ctl 157.4 ± 12.64% vs. mut 168.8 ± 9.22%, MWU(9), p=0.55, not significant). Error bars represent SEM. (Figure 4—source data 1) Graph in Figure 4—figure supplement 1A shows that there is no difference in the raw amount of EdU+ cells per μm3 after 2 hr or 24 hr post-injection as counted from these sections (Figure 4—figure supplement 1—source data 1). (D) Immunohistochemistry of sagittal sections of P9 cerebella from Plxnb2fl/fl and En1Cre;Plxnb2fl/fl littermates injected with EdU 24 hr prior to fixation. EdU labels cells that started their division cycle in the last 24 hr while H3P staining labels dividing cells. The graph shows the amount of cells in the EGL that are both EdU and H3P positive is higher in the Plxnb2 mutant. Error bars represent SEM. Ctl: 2.44 ± 0.29% vs. mut: 6.45 ± 1.07%. MWU(0) p=0.0079. (Figure 4—source data 1) Scale bars: 50 μm in (A, B, C) and (D), 10 μm in high-magnification panels of (D).


