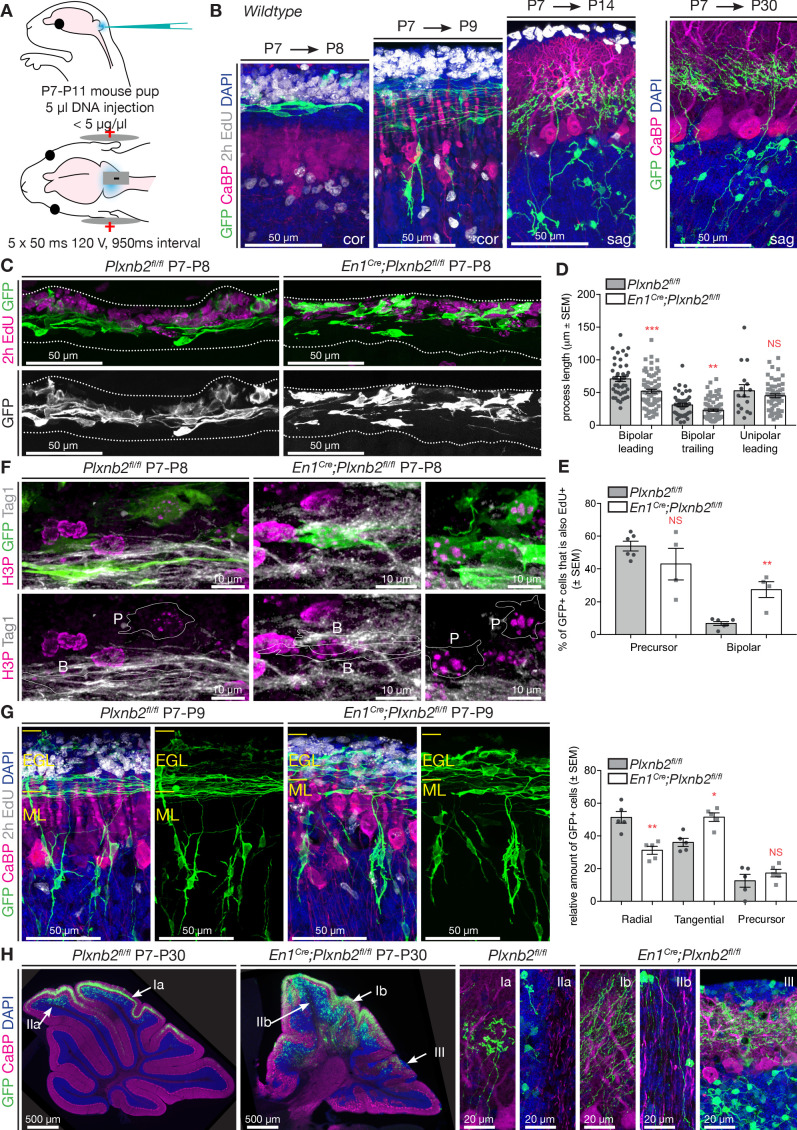
Figure 5. Plxnb2 mutant CGNs display aberrant proliferative and tangential stages.
(A) Schematic representation of the in vivo cerebellum electroporation protocol. See Materials and methods for details. (B) Cerebellar sections of electroporated brains at 1 day, 2 days, 1 week and 3 weeks after electroporation at P7, to illustrate the different stages of CGN development. Sections were immunostaining for GFP, Calbindin (CaBP), to label Purkinje cells. EdU was injected 2 hr prior to fixation, to label proliferating CGNs in the oEGL. One day after electroporation, GFP+ CGNs are still proliferating or became postmitotic and initiated tangential migration. Two days after electroporation GFP+ CGNs start to migrate radially toward the IGL. One week after electroporation all GFP+ CGNs reached the IGL, where they start growing dendrites. After 3 weeks, GFP+ cells have their characteristic morphology with 3–4 claw-shaped dendrites. (C) Immunohistochemistry of coronal sections of cerebellum 1 day post-electroporation. GFP shows the electroporated CGNs and EdU, which was injected 2 hr before fixation, labels proliferating CGNs. Both the distribution and the morphology of migrating Plxnb2 mutant GFP+ CGNs are altered. (D) The graph shows aberrant process length of tangentially migrating CGNs in En1Cre;Plxnb2fl/fl pups. Error bars represent SEM. Bipolar leading process (longest process): ctl 70.86 ± 3.94 μm vs. mut 52.12 ± 2.92 μm, MWU(955) p=0.0002. Bipolar trailing process: ctl 31.1 ± 2.68 μm vs. mut 23.1 ± 1.84 μm, MWU(1117) p=0.0057. Unipolar leading process: ctl: 52.71 ± 9.32 μm vs. mut 45.07 ± 3.02 μm. MWU(416) p=0.75 (not significant). Forty-four wildtype bipolar cells and 73 mutant bipolar cells, and 16 wildtype unipolar and 66 mutant unipolar cells of 6 wildtype and 4 Plxnb2 mutant animals were quantified. (Figure 5—source data 1) (E) Quantification of the % of EdU+ and GFP+ GCNs. In Plxnb2 mutants, many bipolar GFP+ GCNs are also EdU+, unlike in controls (see Figure 5—figure supplement 1). By contrast the % EdU+/GFP+ GCN precursors is similar in Plxnb2fl/fl controls and En1Cre;Plxnb2fl/fl mutants. A total of 447 ctl and 297 mutant precursors, and 451 ctl and 533 mutant bipolar CGNs were counted, from 6 wildtype and 4 Plxnb2 mutant animals. Error bars represent SEM. Precursors: ctl 53.91 ± 3.01% vs. mut 42.97 ± 9.51%, MWU(8) p=0.48 (not significant). Bipolar cells: ctl 6.82 ± 1.17% vs. mut 27.53 ± 4.86%, MWU(0) p=0.0095 (Figure 5—source data 1). (F) P8 coronal sections of the cerebellum, 1 day post-electroporation. Mitotic CGNs in the EGL are immunostained with anti-H3P antibodies. At this stage, GFP+ cells are either in a precursor state (outlined and marked P) or display a clear bipolar morphology (outlined and marked B) and express Tag1, a marker of tangentially migrating CGNs. In controls, only CGN precursor cells express H3P, whereas in Plxnb2 mutants, H3P is found in precursors but also in some Tag1+ bipolar CGNs. (G) Coronal sections of the cerebellum 2 days post-electroporation. GFP immunostaining labels the electroporated CGNs, and EdU (injected 2 hr before fixation) stains proliferating CGNs. Calbindin (CaBP) labels Purkinje cells. GFP+ cells were counted and grouped in radial, tangential and precursor cell stages based on their morphology. In controls, most CGNs have reached radial stage 2 days after electroporation. By contrast, many GFP+ CGNs are still in the tangential phase in Plxnb2 mutants. Radial CGNs are not labeled by EdU. Graph shows that in Plxnb2 mutants, more cells are in the radial stage (ctl 50 ± 2.77% vs. mut 38.28 ± 2.37%, MWU(1) p=0.0159) and less cells in the tangential stage (ctl 34 ± 1.33% vs. mut 47.85 ± 2.37%, MWU(0) p=0.0079). There is no significant difference in cells still in the precursor stage (ctl 16 ± 1.98% vs. mut 13.9 ± 1.71%. MWU(10) p=0.65). Error bars represent SEM. 899 ctl and 744 mutant CGNs were counted, from five animals per genotype (Figure 5—source data 1). (H) Sagittal sections of the cerebellum more than 3 weeks after electroporation with GFP. Electroporated CGNs are stained with GFP, Purkinje cells with Calbindin (CaBP) and sections were counterstained with DAPI. Three different types of defects are seen in Plxnb2 mutants: (I) Parallel fibers that usually occupy a thin part within the molecular layer (Ia) disperse through the entire molecular layer in the mutant (Ib); (II) Whereas the white matter of control cerebella is devoid of parallel fibers (IIa), some mutant CGNs send their axons into the cerebellar white matter (IIb); and (III) ectopic patches of CGNs accumulate at the cerebellar. Ectopic CGNs still acquire their characteristic morphology. Scale bars: (B, C, E): 50 μm; D: 10 μm; (F) overview panels: 500 μm, high-magnification panels: 20 μm.


