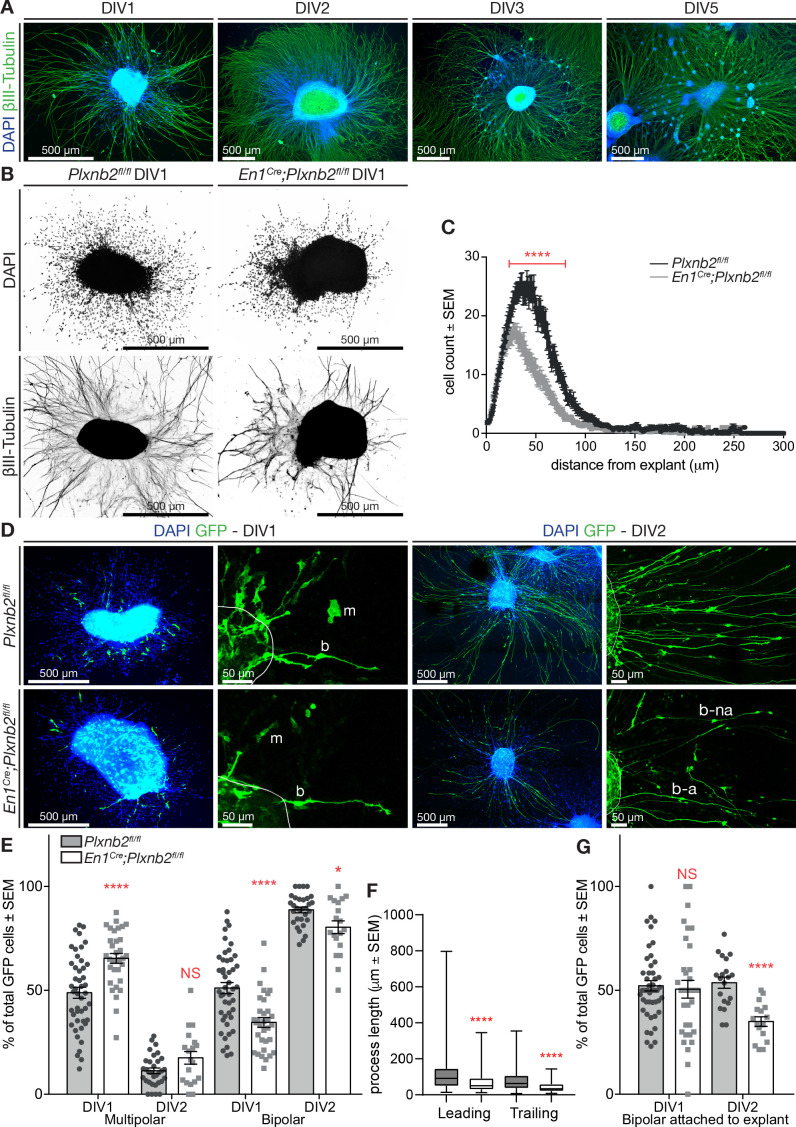
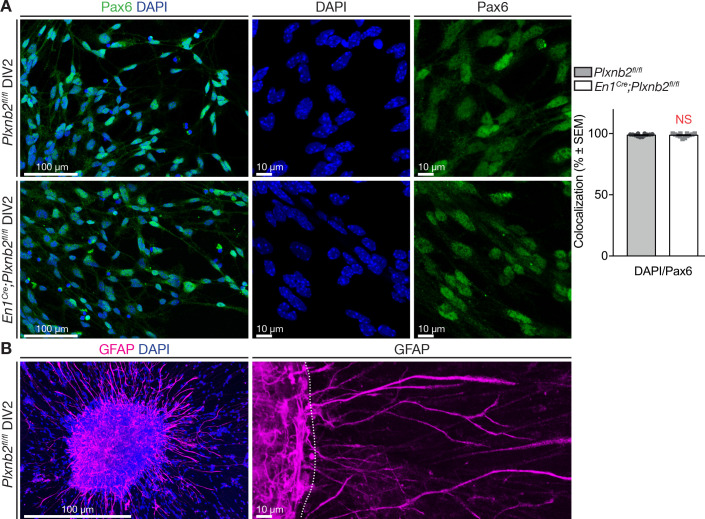
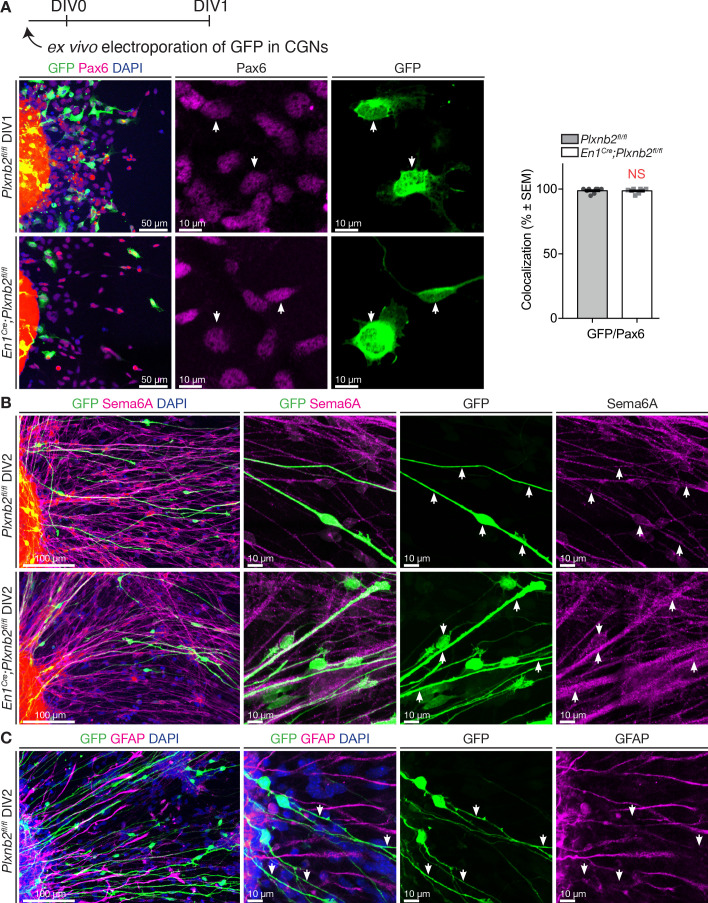
Figure 7. Plxnb2 CGNs recapitulate in vitro the developmental defects found in vivo.
(A) EGL explants from P4-P5 wildtype cerebella, fixed after 1, 2, 3, and 5 days in vitro (DIV). Immunocytochemistry for βIII-tubulin and DAPI shows that cells migrate away from the explant and extend long neurites. After DIV2, cells start accumulating in clusters around the original explant. (B) EGL explants from P4-P5 Plxnb2fl/fl and En1Cre;Plxnb2fl/fl cerebella at DIV1. Cultures were stained for DAPI and βIII-tubulin. Plxnb2 mutant explants show DAPI+ nuclei closer to the explant and different neurite outgrowth. (C) DAPI+ nuclei around the explant were counted and their migration was assessed using a Sholl-analysis. Graph shows that less cells migrate from En1Cre;Plxnb2fl/fl explants and that they stay closer to the explant. Multiple t-test with the Holm-Sidak method were applied to the mean intersections of DAPI+ nuclei with the Sholl circles. p<0.0001. A total of 36 controls and 34 mutant explants were analyzed from three different experiments. Error bars represent SEM. (Figure 7—source data 1) (D) EGL explants from cerebella electroporated ex vivo with GFP and fixed at DIV1 and DIV2. Immunocytochemistry for GFP and DAPI shows the morphology of migrating cells. GFP+ CGNs have either a multipolar (m) or a bipolar (b) shape. After DIV2, almost all GFP+ cells have a bipolar morphology, with their trailing process attached (b–a) or not (b–na) to the explant. (E) Quantification of the proportion of GFP+ CGNs with multipolar or bipolar morphologies. Data is expressed as percentage from total number of GFP+ cells per explant ± SEM. DIV1 multipolar: ctl 48.88 ± 2.65% vs. mut 65.42 ± 2.37%, MWU(353) p<0.0001. DIV1 bipolar: ctl 51.12 ± 2.65% vs. mut 34.58 ± 2.37%, MWU(353) p<0.0001. DIV2 multipolar ctl 11.36 ± 1.33% vs. mut 17.58 ± 3.02%, MWU(226) p=0.13, not significant. DIV2 bipolar ctl 88.67 ± 1.37% vs. mut 80.31 ± 3.07%, MWU(189) p=0.03. All GFP+ cells (amounts between brackets) were counted from 46 ctl (2728) and 33 mut (835) explants (DIV1) and 32 ctl (2284) and 19 mut (617) explants (DIV2) from at least three different experimental repeats. (Figure 7—source data 1) (F) Quantification (Box-plots) of leading and trailing process length of bipolar GFP+ CGNs at DIV1. Leading ctl 106 ± 3.9 μm vs. mut 67.6 ± 5.62 μm, MWU(11147) p<0.0001; trailing ctl 79.5 ± 3.4 μm vs. mut 40.9 ± 2.76 μm, MWU(68833) p<0.0001. A total of 385 ctl and 93 mut cells were analyzed from 29 ctl and 13 mut explants from three experimental repeats (Figure 7—source data 1). (G) Proportion of bipolar GFP+ CGNs attached to the explant. DIV1 attached: ctl 52.19 ± 2.49% vs. mut 50.55 ± 4.27%, (MWU(709.5)) p=0.63, not significant. DIV2 attached: ctl 53.63 ± 2.69% vs. mut 34.92 ± 2.31%, MWU(36.5) p<0.0001. All GFP+ cells (amounts between brackets) were counted from 46 ctl (2728) and 33 mut (835) explants (DIV1) and 32 ctl (2284) and 19 mut (617) explants (DIV2) from at least three different experimental repeats (Figure 7—source data 1). Scale bars: overviews 500 μm (A, B, D); magnifications in (D): 50 μm.


