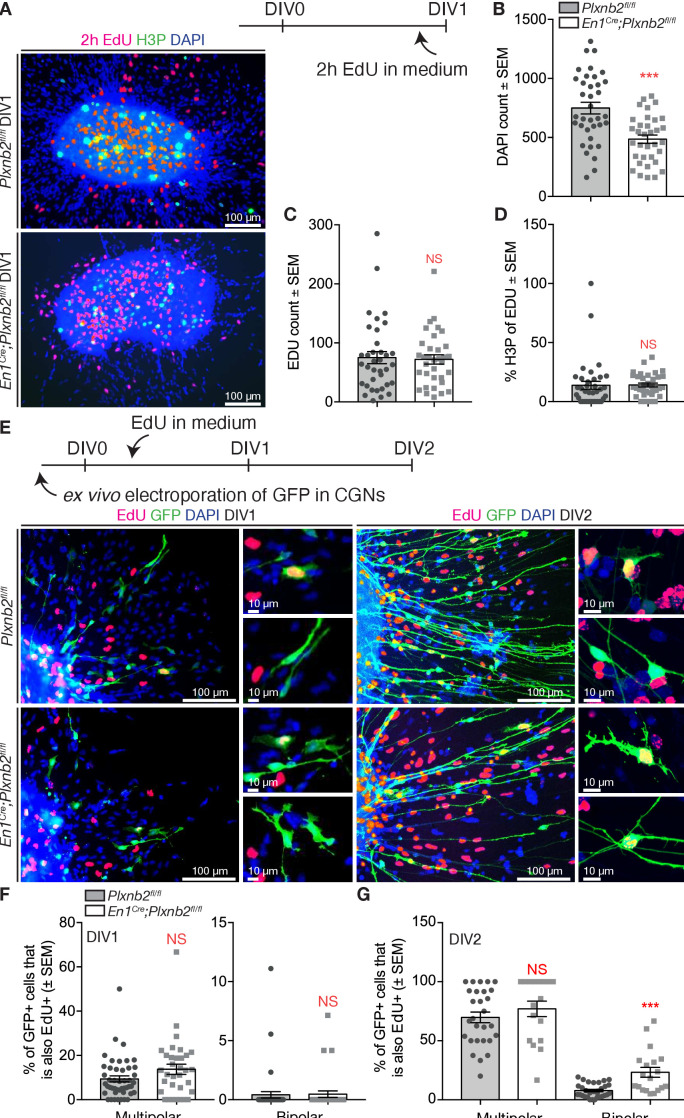
Figure 9. Aberrant proliferation of CGN precursors in Plxnb2 mutant explants.
(A) EGL explants from P4-P5 cerebella at DIV1. Two hr prior to fixation, 10 μM EdU was added to the culture medium. Cultures were stained for EdU, H3P, and DAPI. (B) The number of DAPI+ nuclei/migrating cells around DIV1 explants, is significantly decreased in Plxnb2 mutants (485.79 ± 34.77 cells) compared to controls (748.89 ± 53.54 cells; MWU(290.5) p=0.0001). Error bars represent SEM. 36 ctl and 34 mut explants were analyzed from three different experiments. (Figure 9—source data 1) (C) At DIV1, there is no significant difference in the total amount of EdU+ cells (that incorporated EdU in the last 2 hr) per explant. Ctl 75.19 ± 11.28 vs. mut 72.03 ± 7.85 cells (MWU(596.5) p=0.86. Error bars represent SEM. Thirty-six ctl and 34 mut explants were analyzed from three different experimental replicates (Figure 9—source data 1). (D) Likewise, the portion of EdU+ cells also positive for H3P (an M-phase marker) at the moment of fixation) is similar in controls (13.77 ± 3.80%) and mutants (14.10 ± 0.93%, MWU(477) p=0.11). Error bars represent SEM. Thirty-six ctl and 34 mut explants were analyzed from three different experimental repeats (Figure 9—source data 1). (E) EGL explants from P4-P5 cerebella electroporated with GFP ex vivo. Ten μM EdU was added to the medium after 6 hr of culture. Explants were fixed at DIV1 or DIV2 and EdU incorporation was quantified in multipolar and bipolar GFP+ cells. (F) Quantification of the proportion of multipolar and bipolar GFP+ CGNs that have taken up EdU in the past 18 hr at DIV1 (EdU administered from 6 to 24 hr after plating). Multipolar ctl: 9.394 ± 1.35% vs. mut 13.75 ± 2.31%, MWU(595) p=0.10, not significant; bipolar ctl: 0.41 ± 0.27% vs. mut 0.47 ± 0.27%, MWU(740) p=0.78, not significant. Error bars represent SEM. 2814 ctl and 890 mut GFP+ CGNs were counted from 47 ctl and 33 mut explants from three experimental replicates (Figure 9—source data 1). (G) Quantification of the proportion of multipolar and bipolar GFP+ CGNs that have taken up EdU in the past 42 hr at DIV2 (EdU administered from 6 to 48 hr after plating). Multipolar ctl: 69.81 ± 4.50% vs. mut 77.03 ± 6.55%, MWU(189) p=0.25, not significant. Bipolar ctl: 7.76 ± 1.00% vs. mut 23.3 ± 4.20%, MWU(113) p=0.0001. Error bars represent SEM. 2284 ctl and 617 mut GFP+ cells were counted from 32 ctl and 20 mut explants from three experimental repeats (Figure 9—source data 1). Scale bars 100 μm, high magnifications 10 μm.

