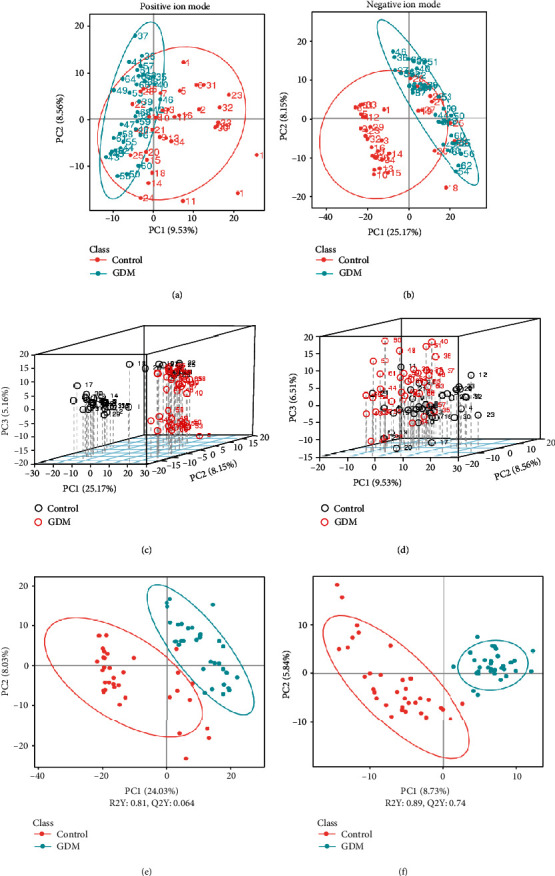
Figure 1.

Metabolomic analysis of control and GDM. (a, b) PCA analysis between control and GDM. (c, d) 3D score plot of PCA analysis between control and GDM. (e, f) PLS-DA analysis between control and GDM, (a, c, e) Positive ion mode. (b, d, f) Negative ion mode.
