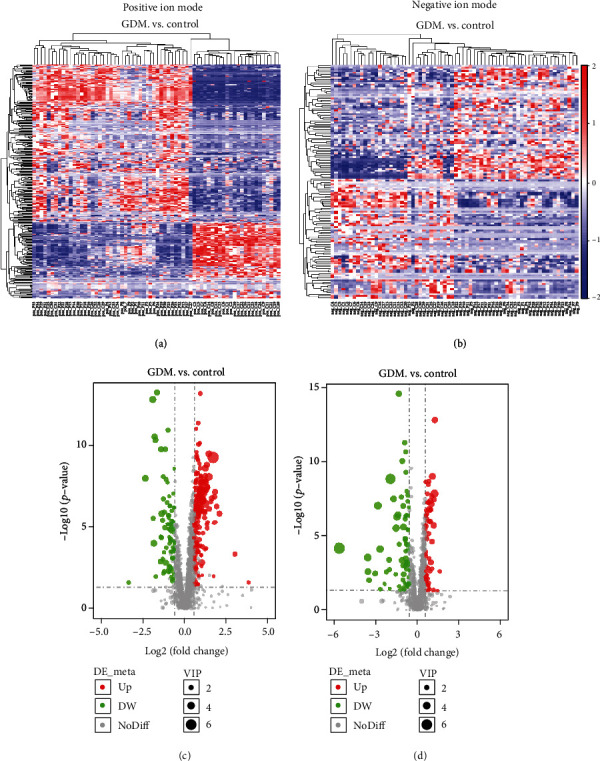
Figure 2.

Analysis of differential metabolites between control and GDM through LC-MS. (a, b) Hierarchical clustering analysis was performed on each group of differential metabolites obtained, and the relative quantitative values of the differential metabolites were converted into z values (z = (x–μ)/σ: x is a specific fraction, μ is average Number, and σ is the standard deviation) and clustering; different color regions represent different clustering group information, similar to the metabolic expression patterns in the same group, and may have similar functions or participate in the same biological process. (c, d) For each metabolite difference multiple, take the logarithm of 2 as the base, and take the p-value to the absolute value of the logarithm of 10 to make the volcano map. (a, c) Positive ion mode. (b, d) Negative ion mode.
