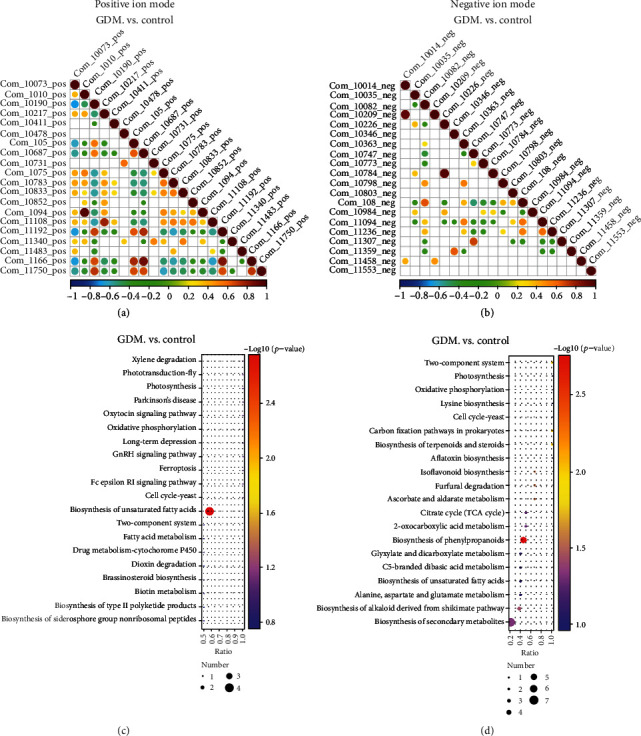
Figure 3.

Differential metabolite KEGG pathway enrichment map. (a, b) When the linear relationship of the two metabolites is enhanced, the correlation coefficient tends to 1 or -1; when positive correlation, it tends to 1, and when it is negatively correlated, it tends to -1. The correlation is a maximum of 1, a complete positive correlation (red), a correlation of -1, and a complete negative correlation (blue). (c, d) KEGG analysis was used to identify the pathways which were significantly enriched by differential metabolites compared to all identified metabolite backgrounds. (a, c) Positive ion mode. (b, d) Negative ion mode.
