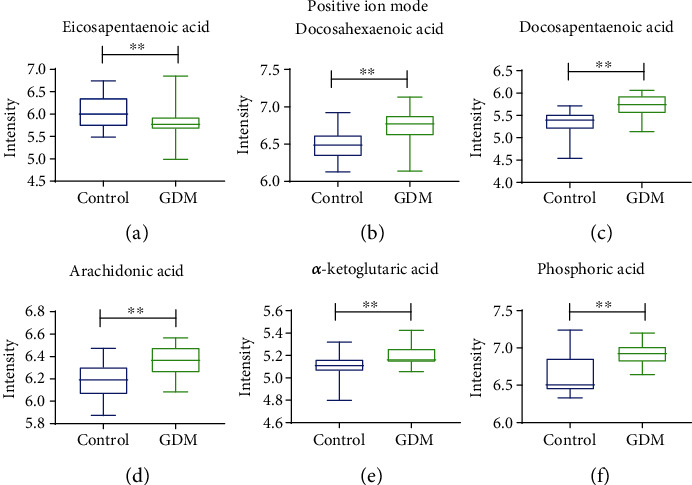
Figure 4.

Boxplots of metabolites between control and GDM under positive ion mode. Student's t-test for measurement data between two groups was performed for significant difference. All data are expressed as the mean ± SEM, and the statistical significance level was set at ∗p < 0.05. ∗∗p < 0.01.
