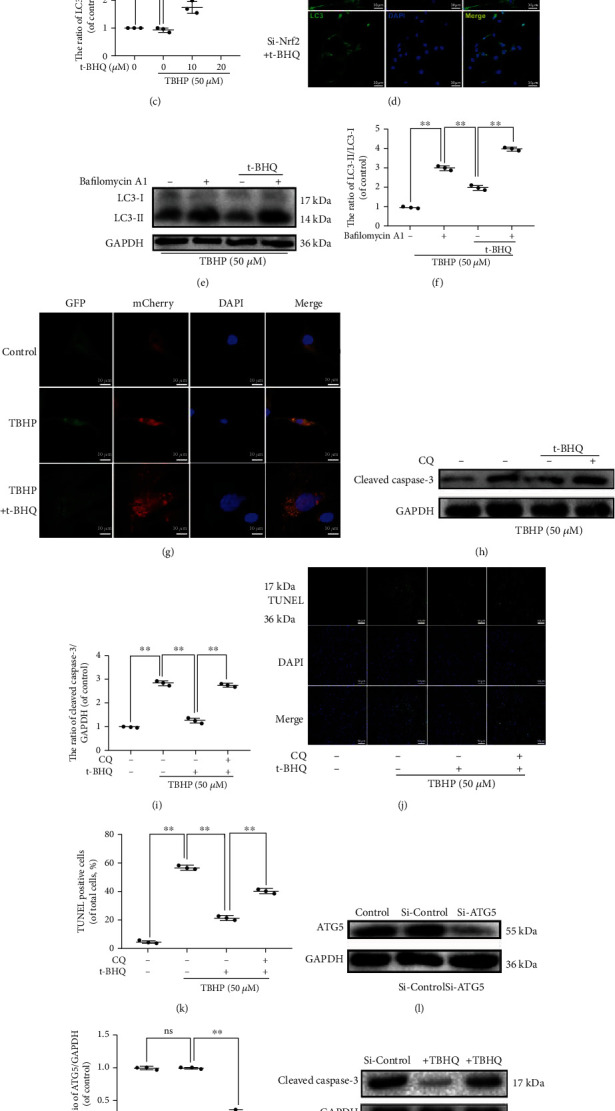
Figure 5.

t-BHQ protects NPCs from cell damage induced by TBHP via activation of autophagy. (a–c) The expressions of LC3-I, LC3-II, and P62 in NPCs treated with different concentrations of t-BHQ and TBHP for 24 h. (d) Representative images of LC3 in NPCs. (e, f) The expressions of LC3-I and LC3-II in NPCs. (g) Representative images of immunofluorescent NPCs expressing mRFP-GFP-LC3. Autophagosomes (yellow dots in merged images) and autolysosomes (red only dots in merged images). Green fluorescence represents GFP, and red fluorescence represents mCherry. (h, i) The expressions of cleaved caspase-3 in NPCs. (j, k) TUNEL was performed in NPCs. (l, m) The expressions of ATG5 in NPCs treated with Si-control and Si-ATG5. (n, o) The expressions of cleaved caspase-3 in NPCs. All experiments were performed three times in duplicate, and data are reported as the mean ± standard deviation (n = 3). ∗p < 0.05, ∗∗p < 0.01.
