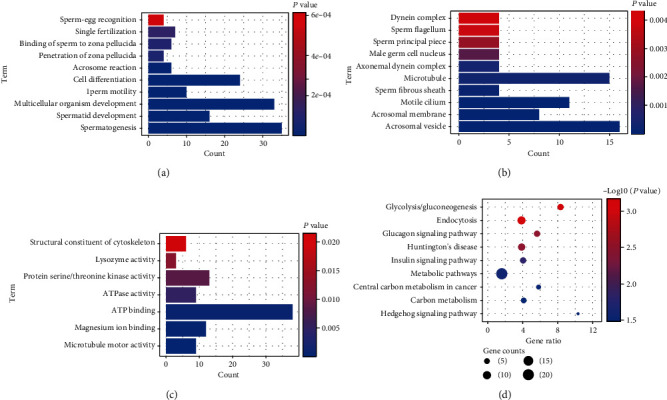
Figure 2.

GO function and KEGG pathway of NOA-related genes. (a) The biological process of NOA-related gene enrichment. The longer the column, the greater the number of genes involved in this term. The redder the color, the higher the significance. (b) The cell composition of NOA gene enrichment. The longer the column, the greater the number of genes involved in this term. The redder the color, the higher the significance. (c) The molecular function of NOA-related gene enrichment. The longer the column, the greater the number of genes involved in this term. The redder the color, the higher the significance. (d) The KEGG pathway of NOA-related gene enrichment. The larger the circle, the greater counts of gene involved in this term. The redder the color, the higher the significance.
