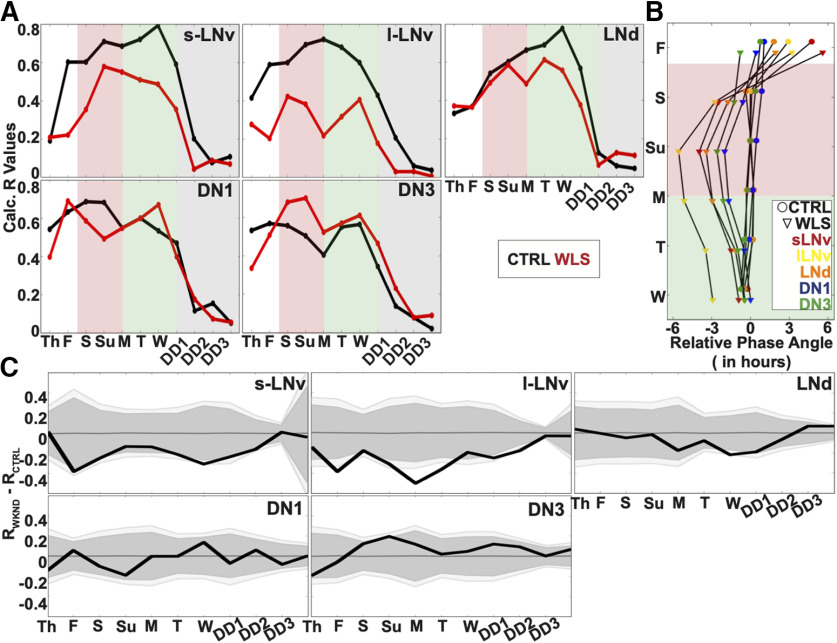
Figure 10.
Circadian neuron subgroup synchrony exhibit destabilization in dynamics during WLS and requires days to recover postshift. Calculated dynamic changes in synchronization index/order parameter, R, measures the level of synchrony for each circadian neuron subgroups using a 1-d rolling window. A, Calculated order parameter, R, comparing LD conditions between Control LD with no shifts (black) and WLS LD with 3-h shifts (red). WLS schedule is marked during the following light schedules: preshift (white shade), WLS (red shade), postshift (green shade), and DD (gray shade). B, Comparison of phase angle changes between each circadian neuron subgroups under control LD (circle) and WLS conditions (triangle). WLS conditions are indicated as follows: preshift (white shade), WLS (red shade), postshift (green shade). Each circadian neuron subgroups for control LD and WLS conditions are as follows: s-LNv (red), l-LNv (yellow), LNd (orange), DN1 (blue), DN3 (green). C, Statistical comparisons of subgroup synchrony between control LD and WLS conditions followed by DD. Difference in order parameter, R, between control and WLS (RWLS-RCTRL) conditions were calculated using a randomization analysis (black trace). Dark and gray zones indicate 95% and 99% confidence bands, respectively, under the null hypothesis that there is no difference in order parameter, R, between brains placed in control LD or WLS LD; values that fall outside the dark band are statistically significant.

