Figure 2.
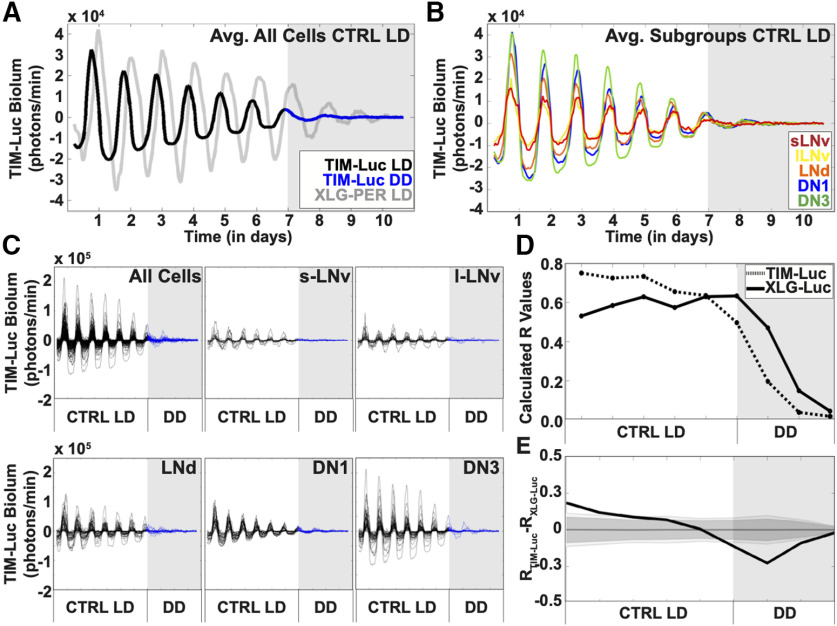
Bioluminescence recording of TIM oscillations in Drosophila circadian neurons. Bioluminescence recordings of TIM-Luc in cultured adult Drosophila brains (n = 6 brains, 159 cells) under control LD (black trace) followed by DD (blue trace, gray shade). XLG-PER-Luc bioluminescence (gray trace) is overlaid for comparison of oscillations between the two genotypes. A, Averaged bioluminescence traces of all TIM-expressing circadian neurons under 7 d of control LD conditions (black trace) followed by DD (blue trace, gray shade). XLG-PER-Luc expression is overlaid for comparison of the two clock proteins (s-LNv = 18 cells, l-LNv = 19 cells, LNd = 18 cells, DN1 = 27 cells, DN3 = 18 cells). B, Averaged bioluminescence traces of TIM expression in circadian neuron subgroups under control LD conditions. Each neuron subgroup is labeled as follows: s-LNv (red), l-LNv (yellow), LNd (orange), DN1 (blue), and DN3 (green) proteins (s-LNv = 15 cells, l-LNv = 24 cells, LNd = 43 cells, DN1 = 35 cells, DN3 = 42 cells). C, TIM bioluminescence traces of individual neurons for all cells (top left panel), s-LNv (top middle panel), l-LNv (top right panel), LNd (lower left panel), DN1 (bottom middle panel), and DN3 (bottom right panel) under control LD conditions. Control LD entrainment involves 7 d of control LD followed by DD (gray shade). D, Calculated synchronization index/order parameter, R values for TIM oscillations (dotted trace) under control LD conditions. XLG-PER-Luc (solid trace), under control conditions is overlaid for comparison. E, Statistical comparisons of overall synchrony between TIM and PER under control LD conditions followed by DD. Difference in order parameter, R, between oscillations of TIM and PER were calculated using a randomization analysis (black trace). Dark gray and light gray zones indicate 95% and 99% confidence bands, respectively, under the null hypothesis that there is no difference in order parameter, R, between the oscillations of TIM and PER under control LD conditions; values that fall outside the dark band are statistically significant.

