Figure 8.
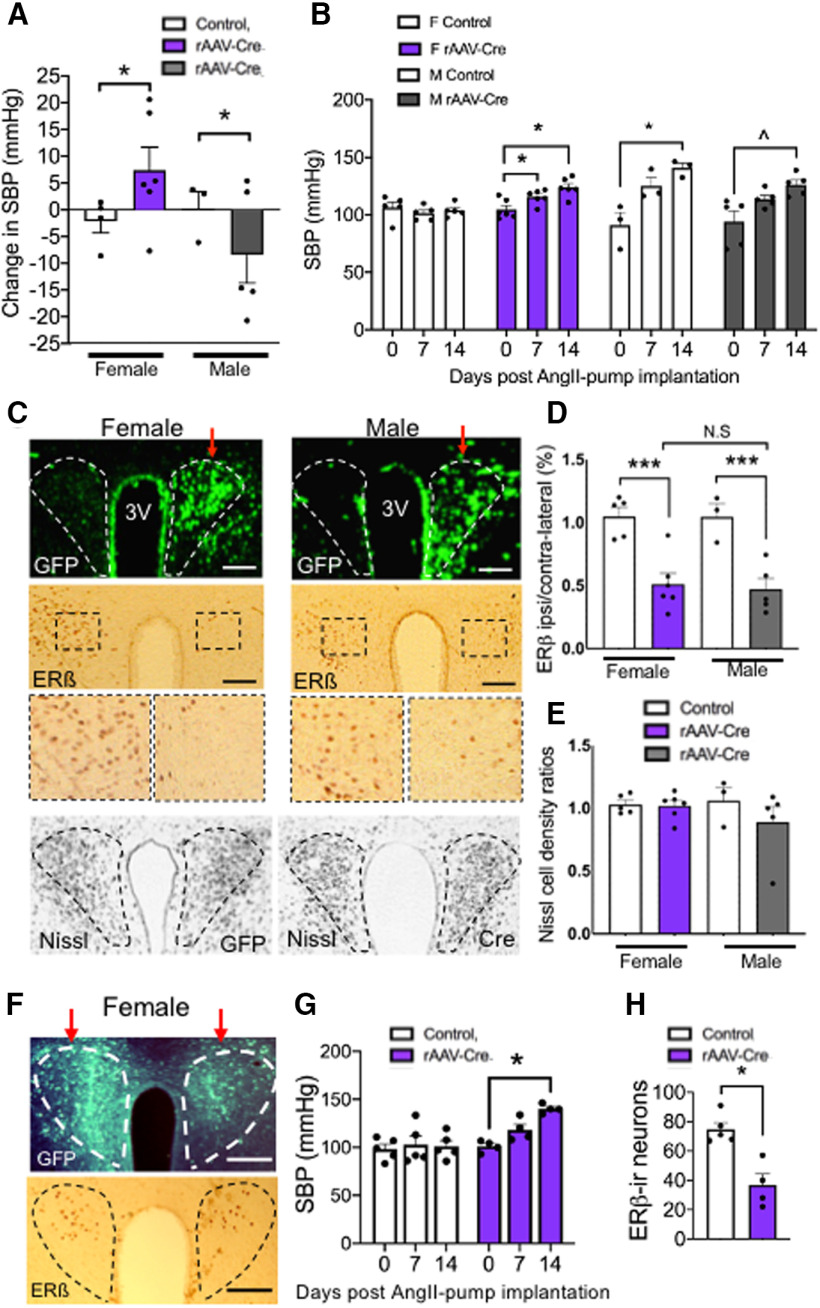
Spatiotemporal deletion of ERβ in the PVN of female mice alters SBP at baseline and following AngII infusion. A, Unilateral rAAV-Cre microinjection in the PVN was associated with increased SBP in females but decreased SBP in males. B, Both female and male mice unilaterally microinjected with rAAV-Cre and infused with AngII showed elevated blood pressure at day 14 relative to baseline. In control microinjected mice, only males showed an increase in SBP. C, Top, Examples of unilateral rAAV-Cre injections (red arrows) in the PVN of female (left) and male (right) fERβ mice. Middle, Low- and high-magnification examples of ERβ-labeling in the PVN from the female and male mice shown in the top panel. The number of ERβ-immunoreactive cells is markedly decreased on the side of the rAAV-Cre injection. Bottom, Examples of Nissl staining in the PVN of rAAV-GFP and rAAV-Cre-injected female mice show similar cell densities independent of ERβ deletion. D, In both males and females, the ratio of ERβ-immunoreactive cells is significantly reduced in the PVN ipsilateral to the rAAV-Cre (colored bars) injection site, whereas the ratio of ERβ is not reduced in the PVN of control animals (white bars). NS, not significant. E, Thionin staining shows no significant differences in the ratio of ipsilateral to contralateral cell densities following rAAV-Cre injection. F, Examples of labeling for GFP and ERβ in the PVN of a female mouse bilaterally microinjected with rAAV-Cre. G, There is an increase in SBP in female mice implanted with osmotic mini-pumps containing AngII and bilaterally microinjected with the rAAV-Cre vector compared with the control vector. H, There is a significant decrease in ERβ-labeled neurons in the PVN in bilateral rAAV-Cre-injected female mice compared with control injected female mice shown in G. *p < 0.05; ***p < 0.0001; ∧p = 0.07; two-way repeated-measures ANOVA followed by Tukey post hoc (A, B (females), G); two-way ANOVA followed by Tukey post hoc (D,E). Data are mean ± SEM. Scale bars, 0.5 mm.

