Figure 4.
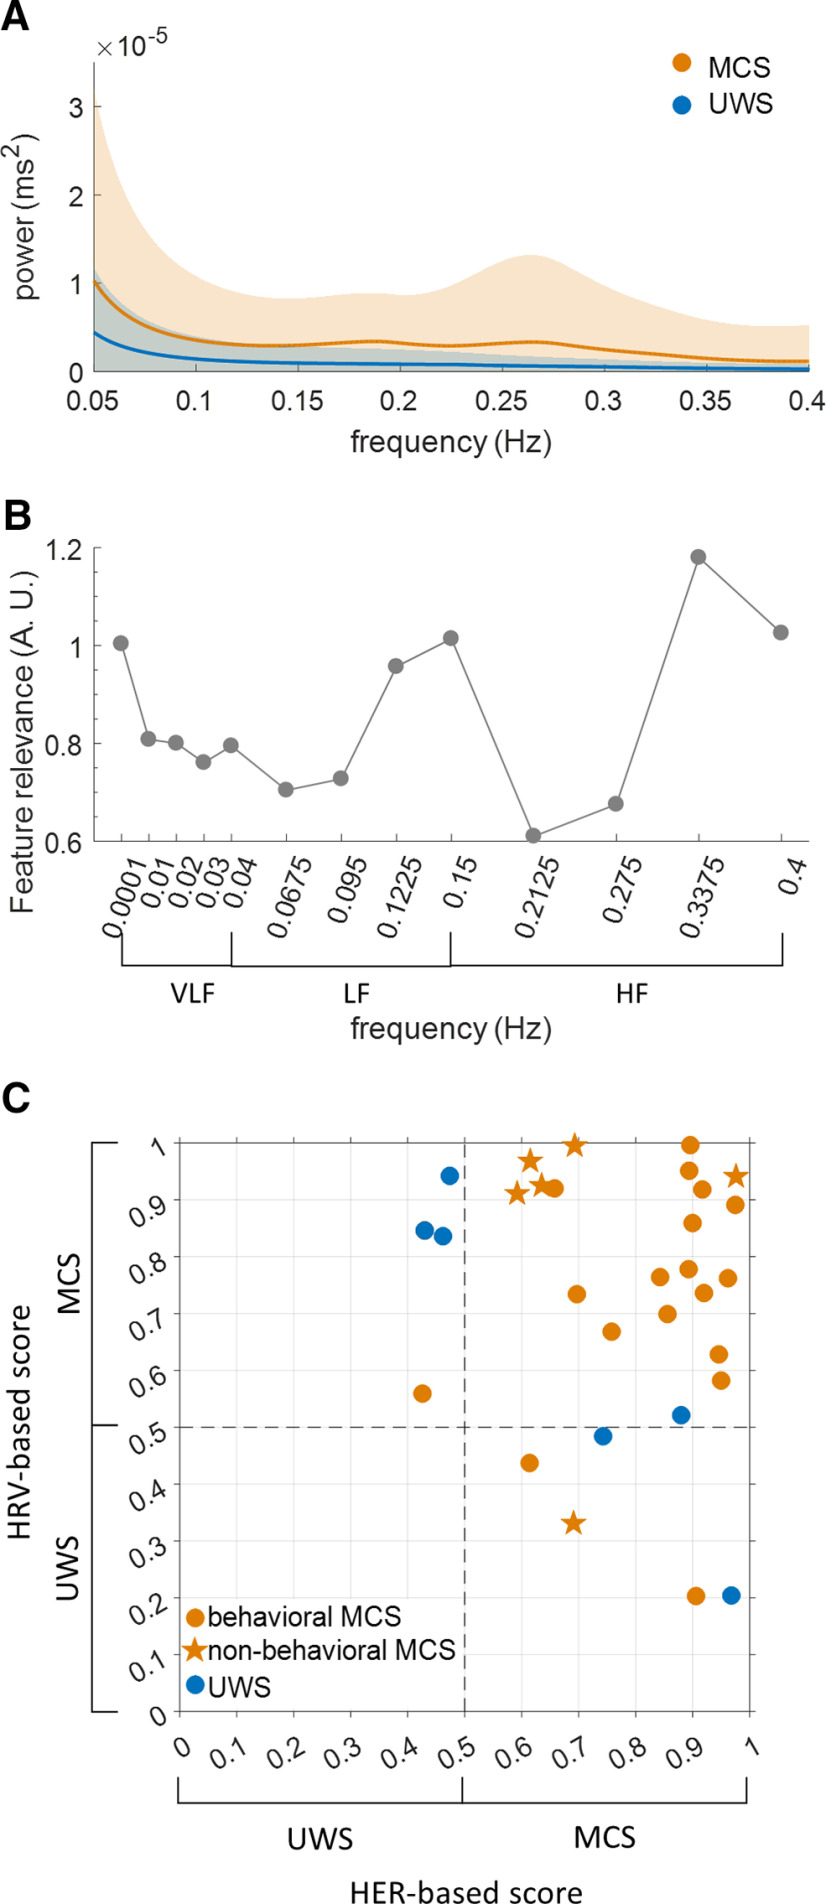
Classifications based on the spectral analysis of heart rate variability. A, HRV power spectrum density of MCS and UWS patients in the training sample. B, Relevance of each frequency (Gini impurity index) to the HRV-based classifier in the training sample, with most relevant frequencies at the border between low-frequency (LF) HRV and high-frequency (HF) HRV and at the upper limit of HF HRV. The contribution of very low frequencies (VLFs) appears limited. C, Consciousness scores obtained from the classifier trained on HRV plotted against consciousness scores obtained from the classifier trained on HERs, in the independent validation sample (n = 30).

