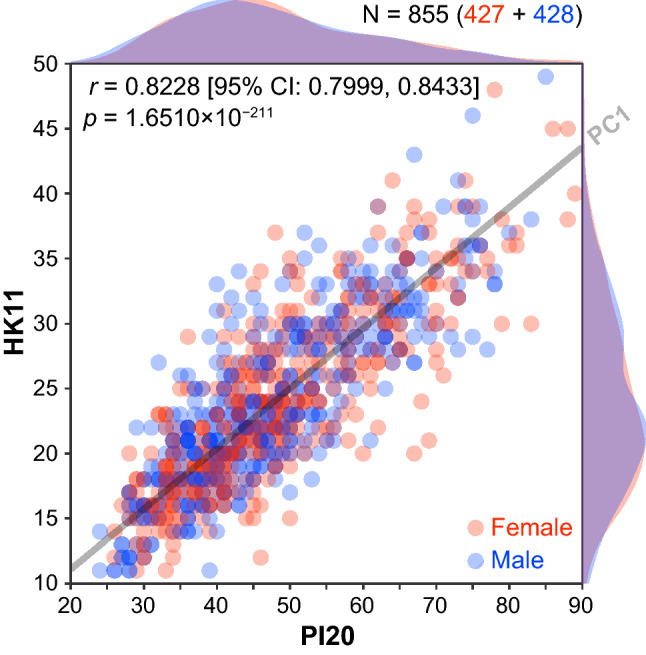
Fig. 1.

Correlation between total scores for the two prosopagnosia questionnaires (Survey). Scatter plot with color-coded transparent density curves of total scores for the 20-item prosopagnosia index (x-axis) and 11 items from Hong Kong prosopagnosia questionnaire (y-axis). Dots represent individual data, and color represents sex (red, female; blue, male). The gray transparent line represents a linear orthogonal regression line (first principal component, PC1 axis), which accounts for more than 90% of the total variance in scores in PCA with a singular value decomposition
