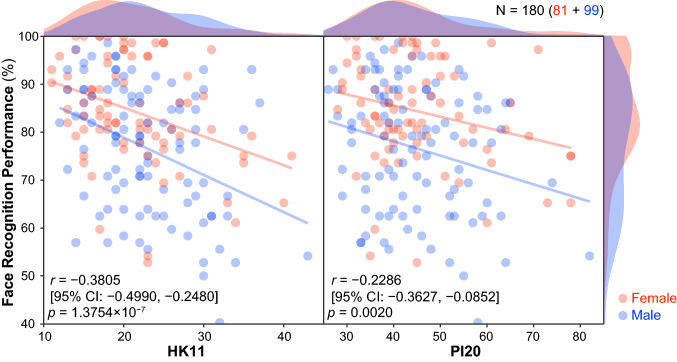
Fig. 3.
Correlation between self-reported face recognition ability (total scores for the PI20 and HK11) and behavioral face recognition performance (Experiment). Scatter plot with color-coded transparent density curves of total questionnaire scores (x-axis; left panel, HK11; right panel, PI20) and behavioral performance on the TFMT (y-axis). Dots represent individual data, and color represents sex (red, female; blue, male). The transparent lines represent linear regression lines for each sex using ordinary least squares

