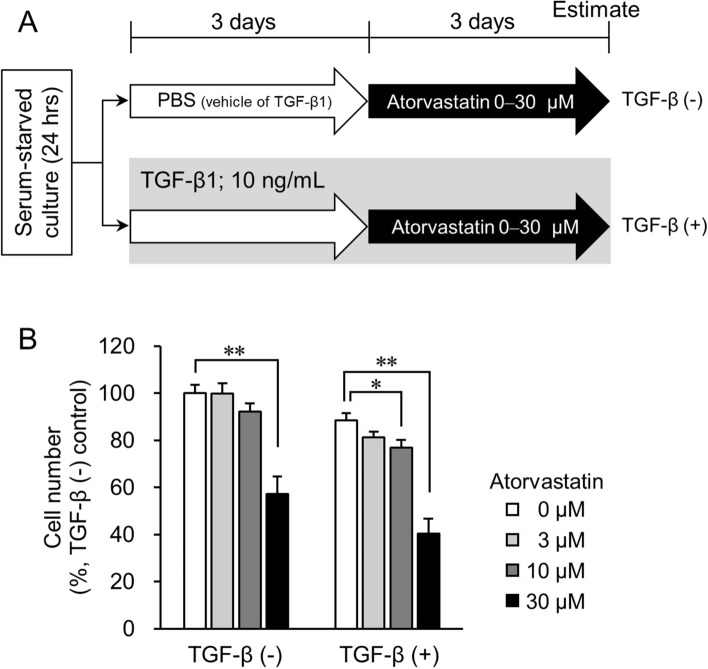
Figure 2.
Effect of TGF-β on growth inhibition induced by atorvastatin in NCI-H322M cells. (A) Overview of experimental procedures. The group treated with atorvastatin post TGF-β1 induction is designated as TGF-β (+). PBS-treated control is designated as TGF-β (−). (B) Cell number in TGF-β (+) group with respect to cell number in TGF-β (−) control cells that was set to 100%. Each value represents mean ± SD (n = 3). Measurement values for each group are compared using the Bonferroni-Dunn post-hoc tests. *p < 0.05, **p < 0.01, with respect to each control group.

