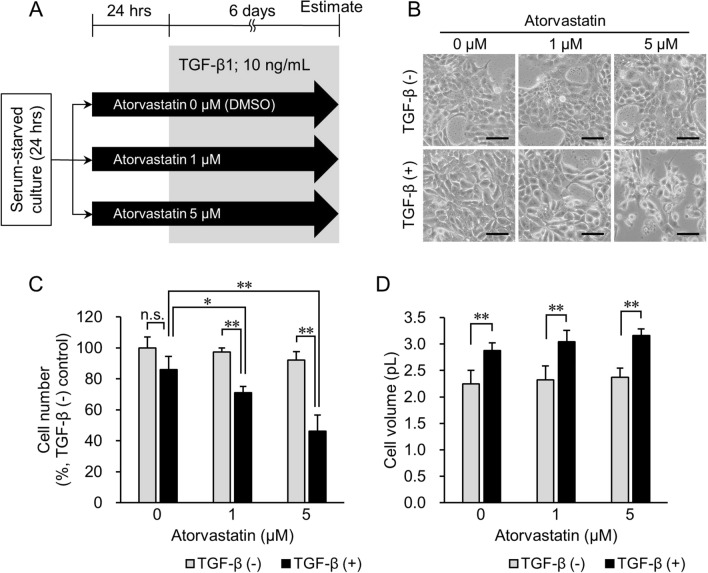
Figure 3.
Effect of pretreatment with atorvastatin on cell number and cell volume in the TGF-β1 (−) and TGF-β1 (+) groups. (A) Overview of experimental procedures. The group treated with TGF-β1 in the presence of atorvastatin is designated as TGF-β (+) group. Cells treated with PBS are designated as TGF-β (−) group. DMSO-treated cells are used as no-drug treatment controls. (B) Phase-contrast imaging of cells treated with 0–5 μM atorvastatin after inducing TGF-β1 signaling. In the TGF-β (−) group (top panel), no significant difference in cell morphology is observed regardless of treatment with atorvastatin. In the TGF-β (+) group (bottom panel), cell number decreased in an atorvastatin dose-dependent manner. Additionally, the cytoplasmic volume of TGF-β (+) cells increased more than that in TGF-β (−) cells. Scale bar = 100 μm. (C) Cell number in the TGF-β (−) group and TGF-β (+) group treated with 0–5 μM atorvastatin. Value in TGF-β (−) control cells (atorvastatin 0 μM) is set as 100%. (D) Cell volume in the TGF-β (−) group and TGF-β (+) group treated with 0–5 μM atorvastatin. Each value represents mean ± SD (n = 3). Measurement values for each group are compared using the Bonferroni-Dunn post-hoc test. *p < 0.05, **p < 0.01, n.s. not significant.

