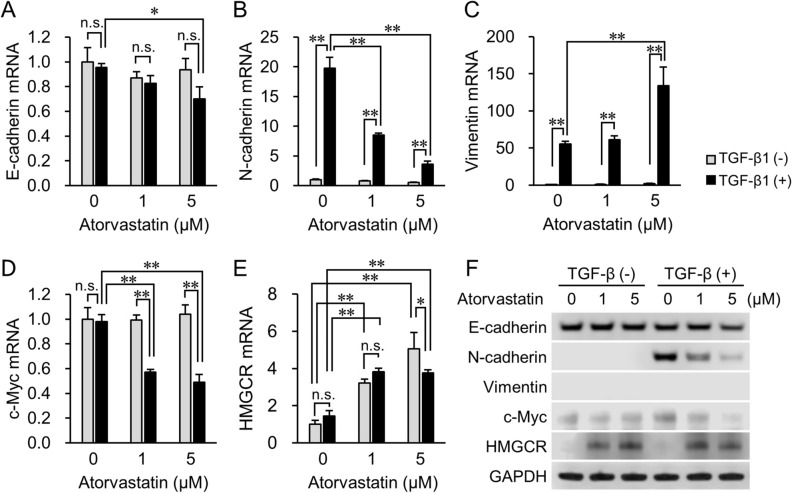
Figure 4.
mRNA and protein expression levels of EMT-related molecules, regulator of cell proliferation, and target of statins in TGF-β (−) and TGF-β (+) groups. Real-time PCR analyses of expression of (A) E-cadherin, (B) N-cadherin, (C) vimentin, (D) c-Myc, and (E) HMGCR genes after the start of TGF-β1 incubation. Cells incubated with PBS are designated as TGF-β1 (−). Data are normalized to 18S rRNA levels in each sample and expressed as values relative to those of the internal control. The measurement values for each group are compared using the Bonferroni-Dunn post-hoc test. Mean ± SD, n = 3, *p < 0.05, **p < 0.01, n.s. not significant. (F) Western blot analysis of the expression of E-cadherin, N-cadherin, vimentin, c-Myc, and HMGCR after induction with TGF-β1. GAPDH expression is used as the loading control. Representative images from three independent experiments are shown.

