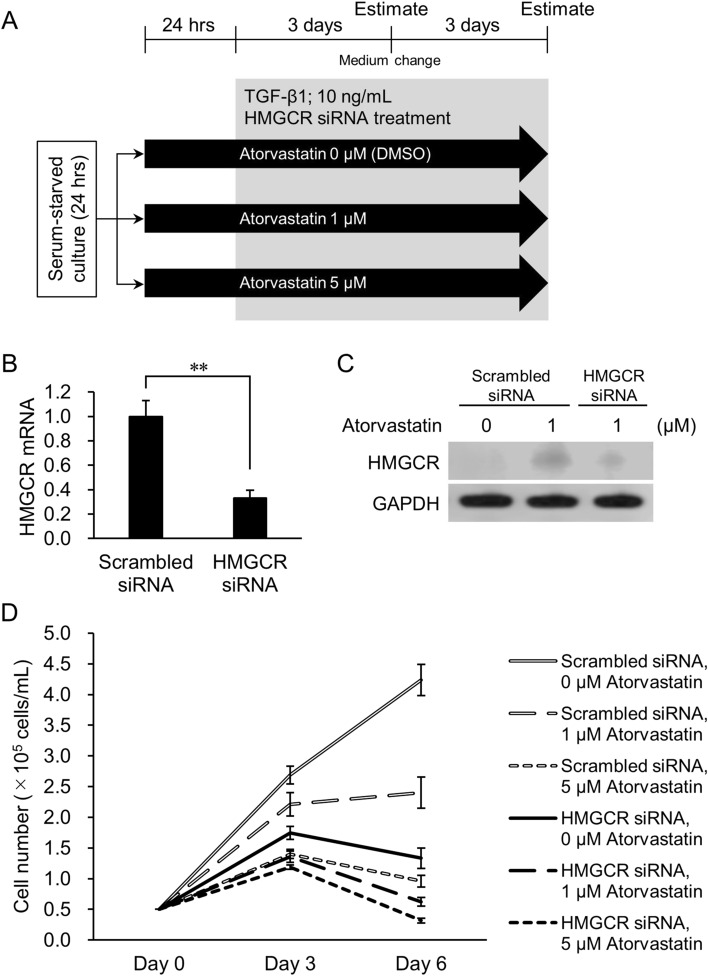
Figure 5.
Effect of HMGCR knockdown on atorvastatin-pretreated and TGF-β-induced NCI-H322M cells. (A) Overview of experimental procedures. Cells were treated with TGF-β1 in the presence of 1 μM or 5 μM atorvastatin and HMGCR siRNA. Scrambled siRNA was used as negative control for RNAi experiment. Cell numbers were counted at days 3 and 6 after TGF-β1 induction. (B) Expression of HMGCR mRNA in cells 3 days after transfection of HMGCR siRNA. Data are normalized to 18S rRNA level in each sample and are expressed as values relative to that of the internal control. The measurement values for each group are compared using student’s two-tailed t-test. Mean ± SD, n = 3, **p < 0.01. (C) HMGCR protein levels in cells 3 days after transfection of HMGCR siRNA. Panel indicates western blot analysis of HMGCR after siRNA transfection in cells. (D) Cell number of the TGF-β1 (+) group treated with 0–5 μM atorvastatin and HMGCR siRNA at days 3 and 6. Each value represents mean ± SD (n = 3). Statistical analysis is shown in Supplementary Table S1.

