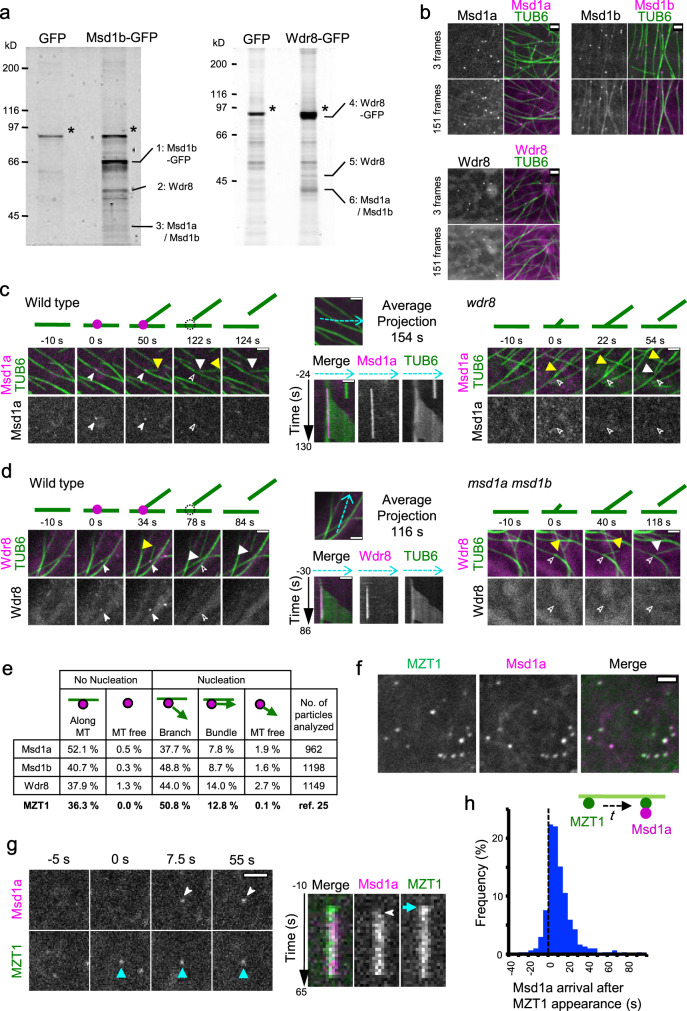
Fig. 1. The Msd1–Wdr8 complex associates with the γ-tubulin ring complex at cortical nucleation sites along the microtubule lattice.
a Immuno pull-down experiments of Msd1- or Wdr8-interacting proteins from Arabidopsis seedlings. Seedlings stably expressing either GFP, Msd1b-GFP, or Wdr8-GFP were used to prepare cell extracts for immunoprecipitation using GFP-antibody beads. Precipitated proteins were separated by SDS-PAGE and detected by staining with Flamingo fluorescent dye. Asterisks indicate major nonspecific bands. This experiment was repeated twice with similar results. b Subcellular localizations of Msd1a-GFP, Msd1b-GFP, and Wdr8-GFP in cotyledon pavement cells when expressed under their native promoters. The TUB6 marker labels microtubules. Snap shots (3 frames) and integrated exposures of 151 frames (302 s total time) are shown. c, d Recruitment of Msd1a-GFP particles (c) and Wdr8-GFP particles (d) to the branch-forming nucleation sites on cortical microtubules in wild-type (left), wdr8 (c, right), and msd1a msd1b (d, right) cells. Time-lapse confocal microscopy images are shown at the indicated times. For wild-type cells, kymographs of Msd1a-GFP (c) or Wdr8-GFP (d) and microtubules were generated along the dotted blue lines in the average projection images of 154 s and 116 s, respectively. Open and closed arrowheads indicate the absence and the presence, respectively, of Msd1a or Wdr8 particles. Likewise, the yellow and white triangles show the plus and minus ends of daughter microtubules, respectively. The events occurring at the indicated time points are schematically presented with microtubules (green lines) and Msd1–Wdr8 particles (magenta circles). e Localization of Msd1a-GFP, Msd1b-GFP, and Wdr8-GFP in relationship to microtubule nucleation was classified into five event groups. Percentages of events observed in five groups and the total number of observed events are shown. f Colocalization of Msd1a-mCherry and MZT1-GFP particles on the cell cortex region in Arabidopsis hypocotyl cells in the average projection images of 62.5 s. More than 110 particles from three cells were observed with similar results. g Recruitment of Msd1a-mCherry and MZT1-GFP particles. Left: time-lapse confocal microscopy images at the indicated times. Right: kymograph generated from the time-lapse microscopy images shown in the left. h Distribution of the arrival times (t in the diagram) of Msd1a-mCherry particles (magenta) after the appearance of MZT1-GFP particles (green) on the cell cortex (n = 304 events from 6 cells). The MZT1 particles arrive prior to the Msd1 particles. Bars, 2 µm.

