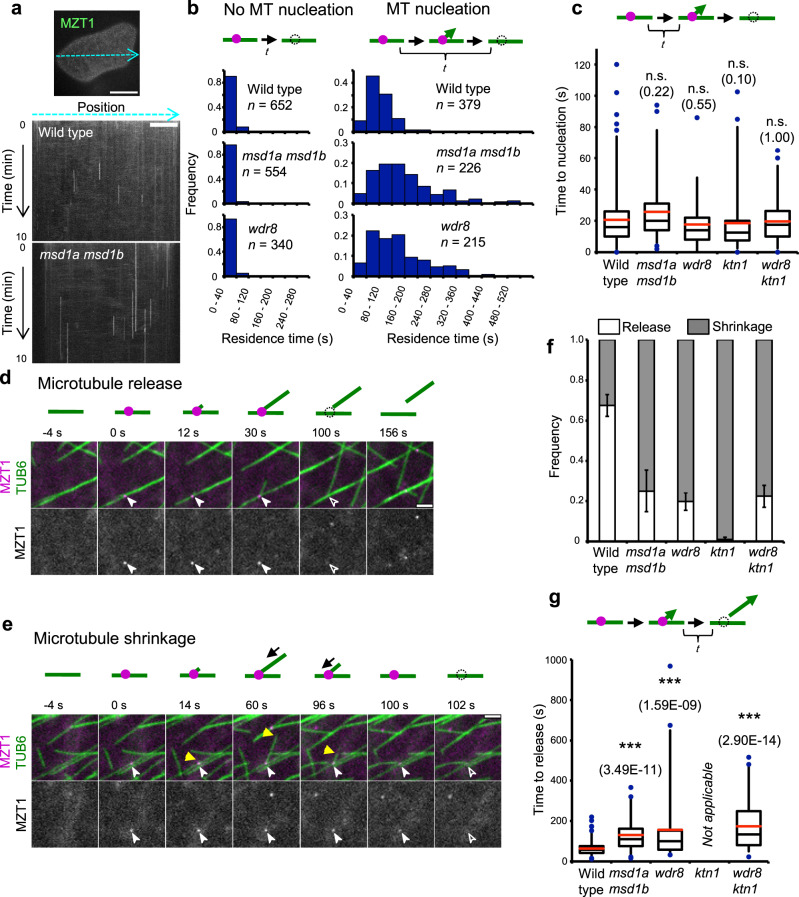
Fig. 2. Mutations of the Msd1–Wdr8 complex delay the time to daughter microtubule release after nucleation.
a Persistence of γTuRC, as labeled with MZT1-GFP, on the cell cortex region was followed over 10 min by time-lapse confocal microscopy in cotyledon pavement cells. Kymograph analysis was performed along images of the cell cortex as exemplified by the blue dotted line in this wild-type cell. Kymographs of a wild-type cell and an msd1a msd1b mutant cell are shown. Bar, 20 μm in the panel image and 10 µm in the kymograph. Three cells were analyzed with similar results. b Distribution of the residence times (t in the diagram) of the MZT1-GFP particles (magenta circles) on the mCherry-TUB6-labeled cortical microtubules (green lines) in wild type (seven cells), msd1a msd1b (four cells), and wdr8 (five cells). The particles were classified into those that disappeared without or after microtubule nucleation. In the mutant cells, nucleating γTuRC particles tend to stay longer on the microtubule lattice. c Times to nucleate nascent microtubules (t in the diagram) from the lattice-bound γTuRC (magenta circles) in wild type (235 events from 6 cells), msd1a msd1b (58 events from 6 cells), and wdr8 (76 events from 9 cells), ktn1 (177 events from 4 cells), and wdr8 ktn1 (66 events from 4 cells). Nucleating times of the mutants are not significantly different from that of wild type (p > 0.09, determined by the Steel–Dwass test). The bottom and top of each box represent the first and third quartiles, respectively, the horizontal line inside each box is the median (second quartile) and the red horizontal line represents the average. The whiskers range between 2nd percentile and 98th percentile. Data points outside this range are considered as outliers and are indicated as circles. n.s., not significant. Exact p-values are indicated in parentheses. d, e Time-lapse confocal microscopy images of the minus-end release event (d) and the complete shrinkage event from the plus end (e) of daughter microtubule at the indicated times in wild-type cells. γTuRC (magenta circles in the diagrams) and microtubules (green lines) are labeled by MZT1-GFP and mCherry-TUB6, respectively. Open and closed arrowheads and yellow triangles respectively indicate the absence and the presence of MZT1 particles and the plus ends of daughter microtubules. Bars, 2 µm. f Proportions of the MZT1 particle disappearance caused by the minus-end release (green) and the plus-end shrinkage (magenta) in wild-type (449 events from 7 cells), msd1a msd1b (223 events from 6 cells), and wdr8 (367 events from 7 cells), ktn1 (301 events from 4 cells), and wdr8 ktn1 (294 events from 4 cells). The error bars indicate SD. g Times (t in the diagram) for daughter microtubules to be released from mother microtubules after nucleation. The event numbers for each genotype are the same with c. In the diagram, a daughter microtubule grows at the plus end (arrowhead) after nucleation from γTuRC (magenta). ***p < 0.0001, determined by the Steel–Dwass test. Exact p-values are indicated in parentheses. The analysis is not applicable for the ktn1 cells where the release events are very rare. The elements of the box plot are defined as in c.

