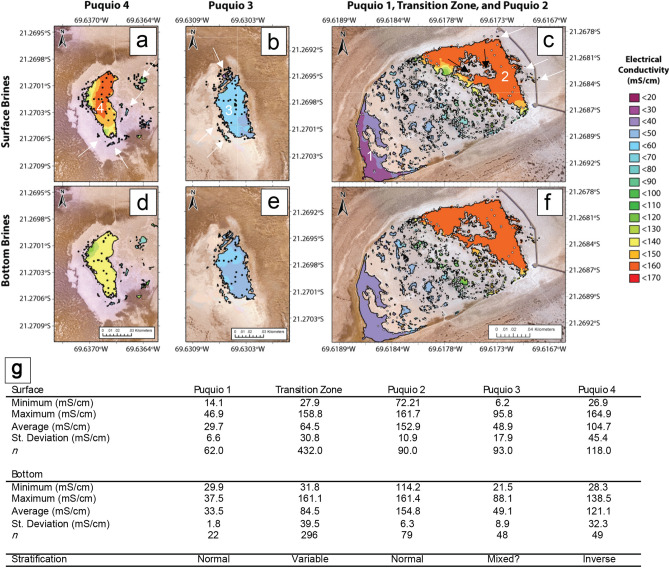
Figure 2.
Contour maps of in situ electrical conductivity (mS/cm) in the Puquios. Measurement locations are shown as black dots (Puquios 3 and 4), and white dots (Puquios 1, 2, and the Transition Zone). Scale of all maps is 1:1180 km. Surface brine measurements are shown in (a–c) and bottom brine measurements are shown in (d–f). Maps were created in ArcGIS Pro https://www.esri.com/en-us/arcgis/products/arcgis-pro. Minimum and maximum measurements of electrical conductivity (mS/cm) in the surface and bottom brines of each of the Puquios during the November 2017 field campaign are shown in (g). Stratification was assessed following the methods of Babel (2004) and refers to the main lagoon waters and the smaller peripheral lagoons.

