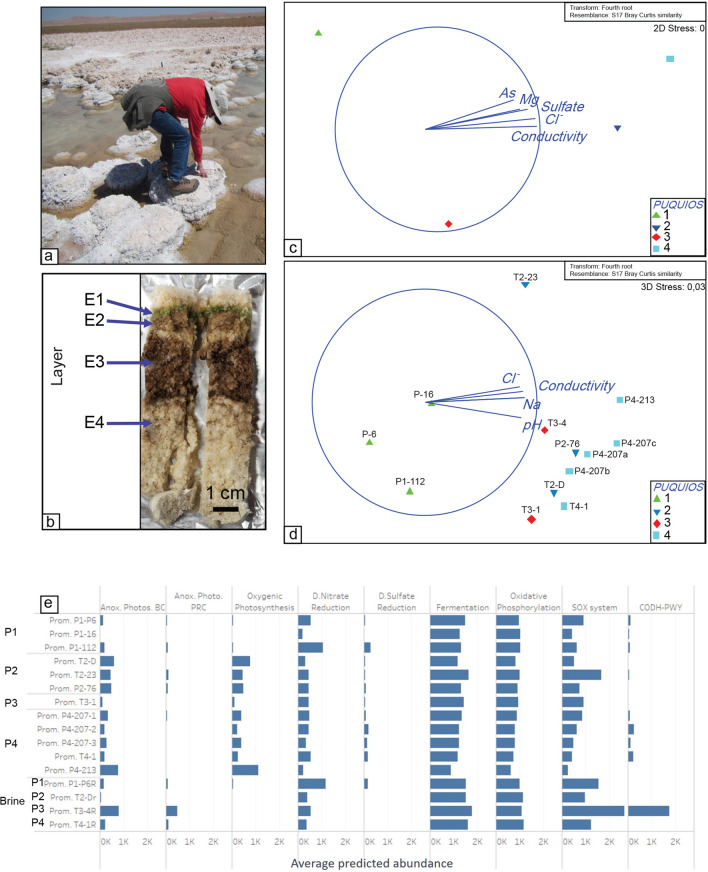
Figure 4.
Microbial community variability in subaerial structures and associated brines. Photographs showing the area sampled from subaerial structures surrounding the Puquios (a) and the E1 layer sampled within the mini-core for analysis (b). Non-metric multidimensional scaling for OTUs with vectors overlay showing correlation of environmental variables in the brines (c) and E1 layer of subaerial structures (d). Relative abundance of microbial metabolisms as predicted by PICRUst is shown in (e).

