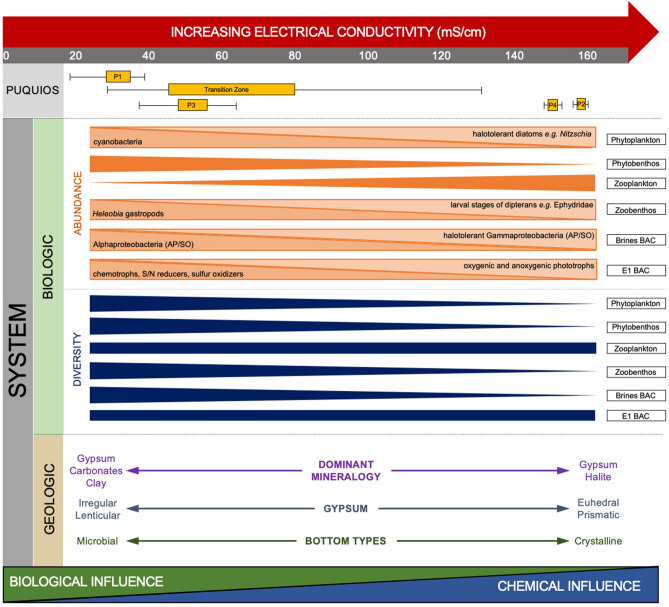
Figure 7.
Summary diagram showing a conceptual framework of the trends observed in the biologic and geologic components of the Puquio system across an increasing gradient in electrical conductivity. Brine BAC refers to bacterial communities in the brines. E1 BAC refers to bacterial communities in the E1 layer. Thickness of diversity and abundance bars indicate general trends as supported in Figs. 3, 4 and Supplementary Figs. S2–S4. In cases where total abundance showed no apparent relation with EC (e.g. Phytoplankton, Zoobenthos, Brines BAC, and E1 BAC), the bars were subdivided to highlight the effect of EC on individual functional groups. AP anoxygenic phototrophs, SO sulfur oxidizers, S sulfate, N nitrate. Figure was created in Microsoft PowerPoint for Mac v16.48. https://www.microsoft.com/en-us/microsoft-365/powerpoint.

