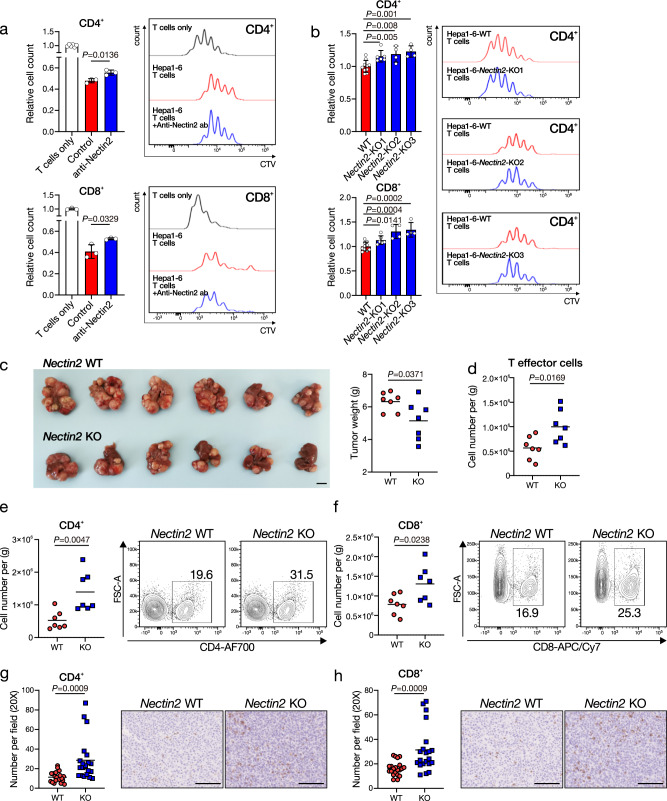
Fig. 5. NECTIN2 in HCC cells suppresses T cell activity.
a CellTrace Violet (CTV)-labeled mouse splenic T cells were isolated and co-cultured with Hepa1–6 cells in the presence or absence of anti-Nectin2 neutralizing antibody (15 µg/mL). Mean ± SD is presented. b CTV-labeled T cells were cocultured with Hepa1–6 (WT), -Nectin2-KO1, -Nectin2-KO2, -Nectin2-KO3 cells. Mean ± SD is presented. c Representative picture and weight of Nectin2 WT (Nectin2WT:Tp53KO:c-MycOE), and Nectin2 KO (Nectin2KO:Tp53KO:c-MycOE) HCC tumors. Scale bar = 1 cm. d–f Numbers of tumor-infiltrating lymphocytes were analyzed by flow cytometry. g, h Representative pictures, and quantification of CD4 + T cells and CD8 + T cells in HCC tumors by IHC staining. Scale bar = 100μm in IHC representative pictures. a–h Student’s t test. The experiment was performed with a variable number of biologically independent samples (n number) (a n = 6, n = 3, and n = 3 for T cells only Ctrl and anti-Nectin2 respectively in CD4+ cells, and n = 3 for all groups in CD8+ cells; b n = 10, n = 6, n = 4, and n = 4 for WT, Nectin2-KO1, Nectin2-KO2, and Nectin2-KO3, respectively in both CD4+ and CD8+ cells; c–e, g: n = 7 per group; f, h: n = 21 per group). Source data are provided as a Source Data file.

