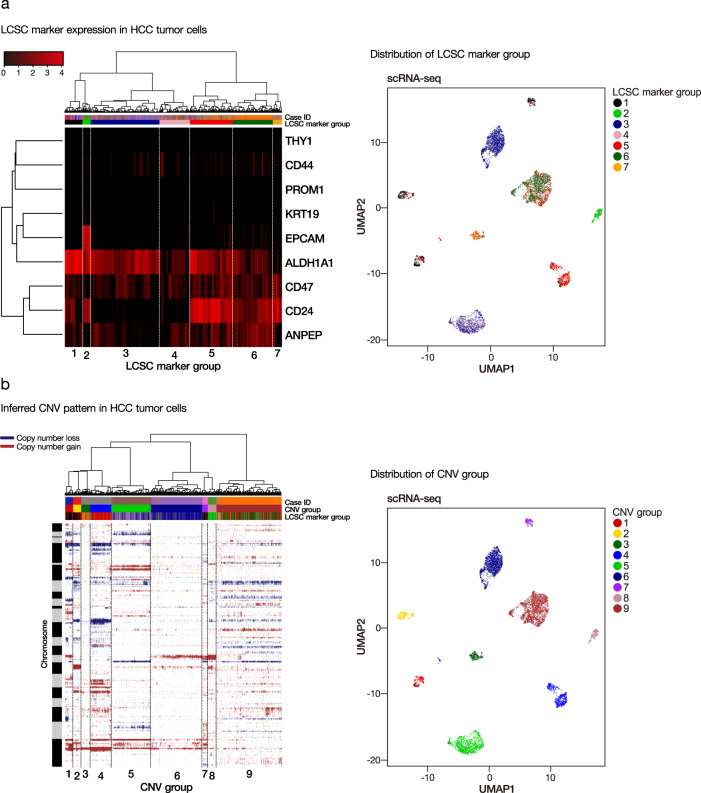
Fig. 6. Tumor heterogeneity in terms of LCSC marker and inferred CNV status.
a We stratified the HCC tumor cells according to LCSC marker expression into different LCSC marker groups (left). The distribution of LCSC marker groups was displayed in the UMAP plot (right). b HCC tumor cells were also stratified according to inferred CNV patterns into different CNV groups (left). The distribution of CNV groups was displayed in the UMAP plot (right).

