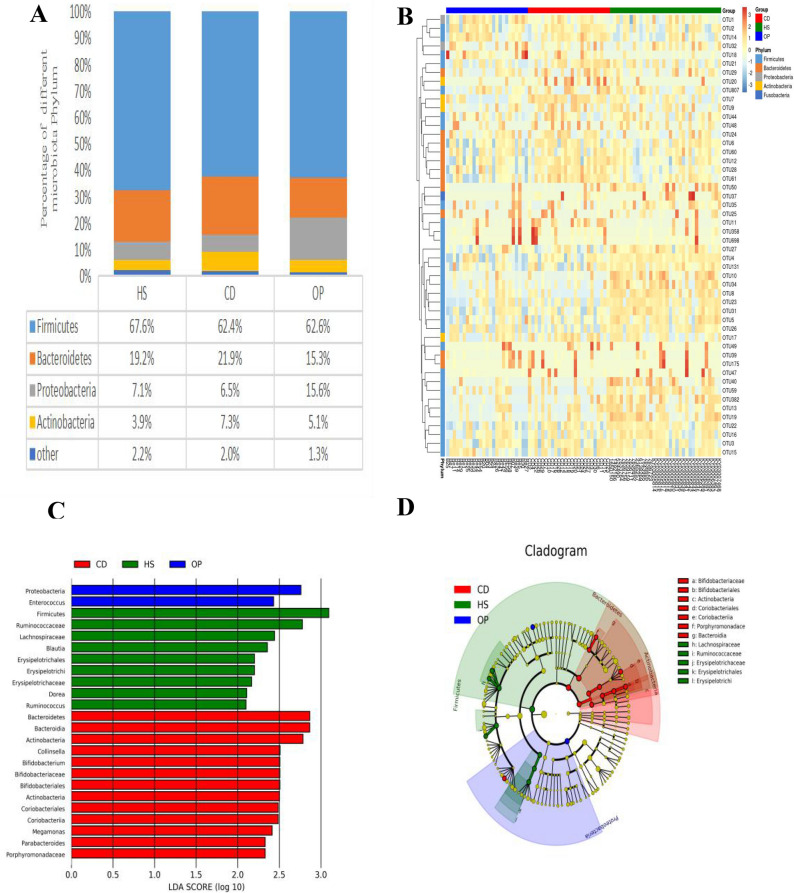
Figure 1.
Differences in gut microbiome biodiversity across the two patient groups and one group of healthy controls. The three populations were CKD patients on colonic dialysis (CD, red) or not (OP, blue), as well as healthy controls (HS, green). (A) Gut microbiome profiles at phylum level. (B) The top 50 operational taxonomic units (OTUs) of all samples were used to generate a heat map. The x-axis represents the sample; the y-axis, OTUs. Color shading reflects OTU abundance. (C) Analysis of linear discriminant analysis effect size (LEfSe) was performed on the three groups. The x-axis indicates the linear discriminant analysis (LDA) score; the y-axis, the taxa that help distinguish the three groups from one another. The larger the value is, the greater is the difference. Different colors represent different groups. (D) Cladogram, in which the small circles radiating from the inside to the outside represent the classification level of the species at the level of phylum, class, order, family, and genus. The diameter of the small circle represents relative abundance. The nodes of different colors in the phylogenetic tree are the microbial groups that distinguish the given group from the two others. The closeness and partial overlap of green and red areas in the phylogenetic tree suggest that the intestinal microbiome of CKD patients on colonic dialysis was more similar to that of healthy subjects than to that of patients not on dialysis.

