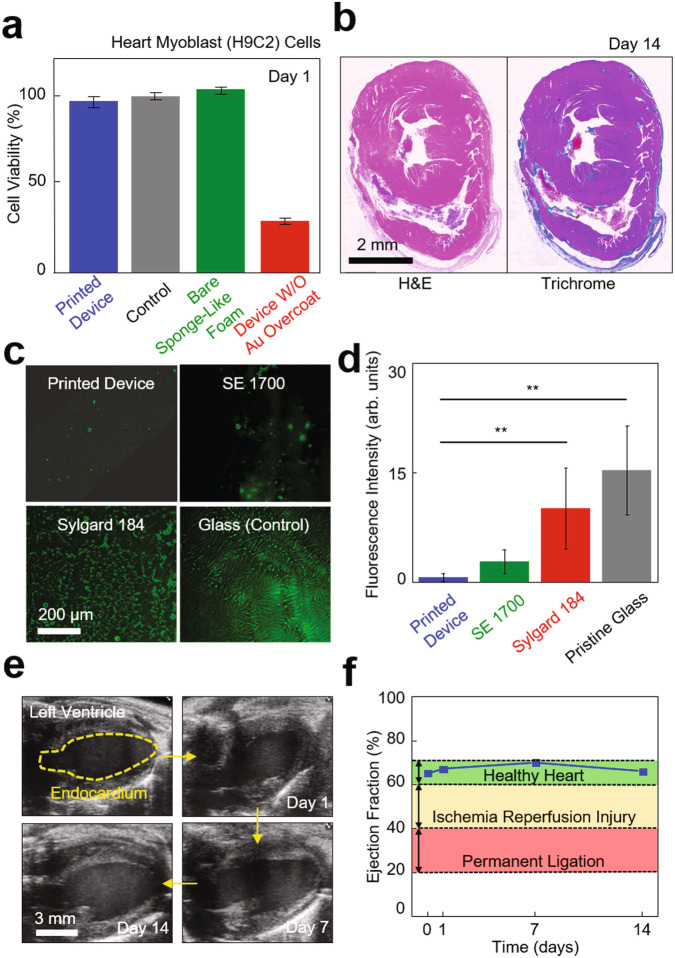
Fig. 6. Evaluation of biocompatibility, anti-biofouling, and effect on cardiac function.
a Results of cell compatibility assay for the custom-printed sensor array with heart myoblast (H9C2) cells in a 24-well plate, as measured using a colorimetric assay kit (n = 3 per group). b Representative histological cross-sectional views of the murine cardiac tissues that were stained with both hematoxylin-eosin (H&E; left panel) and Masson’s trichrome (MTC; right panel) on day 14 post-implant of the custom-printed sensor array. c Z-stack fluorescence images of a BSA-FITC (6 mg/ml) coated on the printed device as compared to control groups made of the SE 1700 ink and the Sylgard 184 ink and prepared on a pristine glass, from upper left to bottom right clockwise. d Results of one-way ANOVA tests with Bonferroni correction (n = 5 per group). Fluorescence intensity of pristine glass and sylgard 184 is shown as average ± standard deviation (**p = 3.4 × 10⁻⁷, 4.1 × 10⁻⁴), versus printed device. e Representative ultrasound images of the left ventricle of a murine heart on 0, 1, 7, and 14 days implantation of the custom-printed sensor array. f Results of the ejection fraction of the murine heart post-implant.

