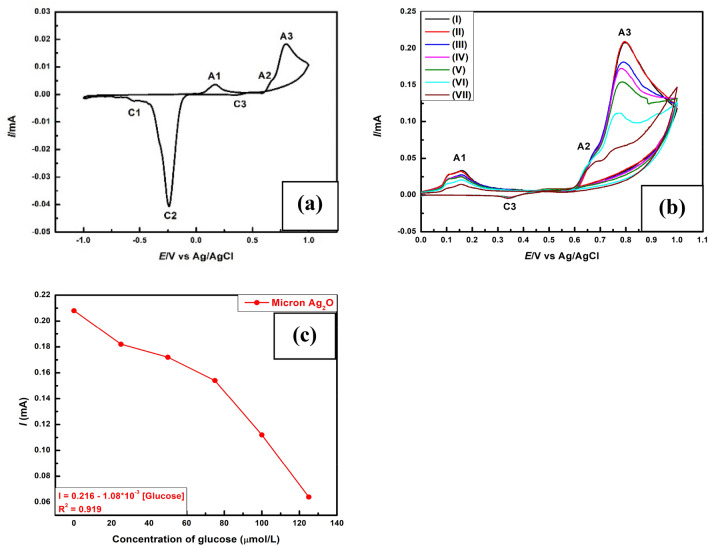
Fig. 5.
a Cyclic Voltammograms of micron Ag2O particles deposited on Glassy carbon electrode (GCE) in alkaline electrolyte. b Cyclic Voltammograms of micron Ag2O particles in absence of glucose [cycle1 (I) and cycle2 (II)] and in the presence of glucose having concentration 25 μmol/L (III), 50 μmol/L (IV), 75 μmol/L (V), 100 μmol/L (VI), 125 μmol/L (VII). c Plot of A3 peak current vs. glucose concentration

