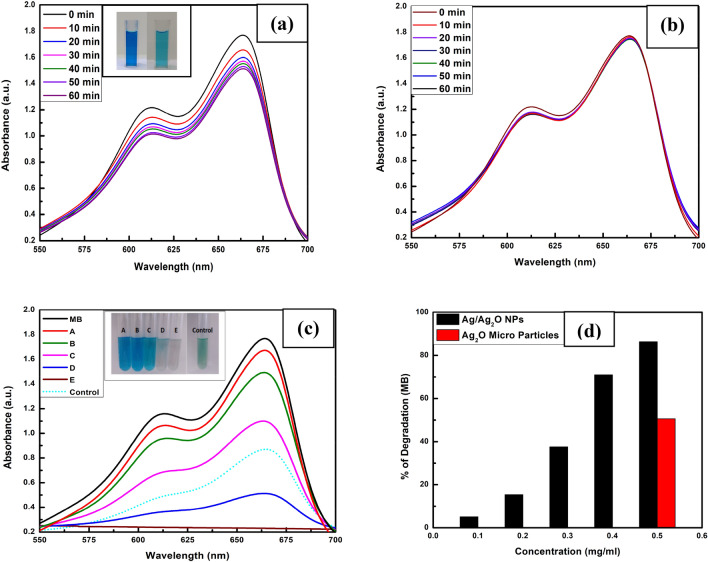
Fig. 6.
UV–Vis absorption spectra of the aliquots recorded with 0.1 mg/ml Ag/Ag2O NPs (a) and Without (b) Ag/Ag2O NPs at a regular time interval of 10 min ambient temperature. c Ag/Ag2O NPs weight dependent (from 0.1 mg/ml to 0.5 mg/ml) absorption spectra at a fixed time of 10 min and d Percentages (%) of MB degradation graph

