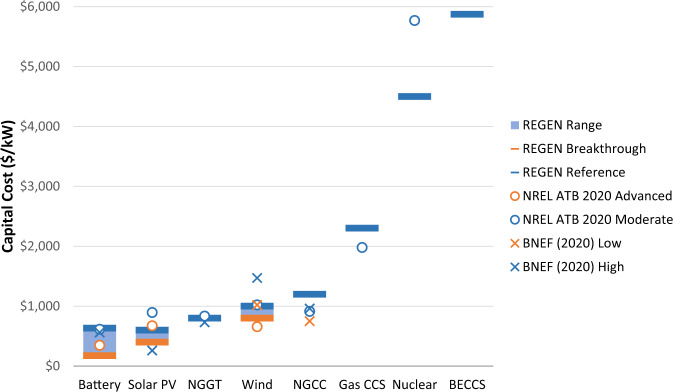
Fig. 1. Capital cost assumptions (2018 USD per kW capacity) by technology in REGEN.
REGEN values come from EPRI’s Integrated Technology Generation Options report26 and expert elicitations. Reference assumptions are shown in blue, and breakthrough (i.e., low cost) assumptions are shown in orange for batteries, solar, and wind. Comparisons are provided with NREL’s 2020 Electricity Annual Technology Baseline (ATB)61 and BloombergNEF’s “Levelized Cost of Electricity 2H 2020”62. Solar costs are expressed in $/kWAC terms. Battery costs in $/kW terms are shown for a 4-h duration system. Additional assumptions are discussed in the “Methods” section, Supplementary Note 1, and EPRI23. Source data are provided as a Source Data file.

