
Fig. 1. L-Asp transport rates catalyzed by purified and reconstituted GltTk as a function of the concentrations of Na+ and L-aspartate.
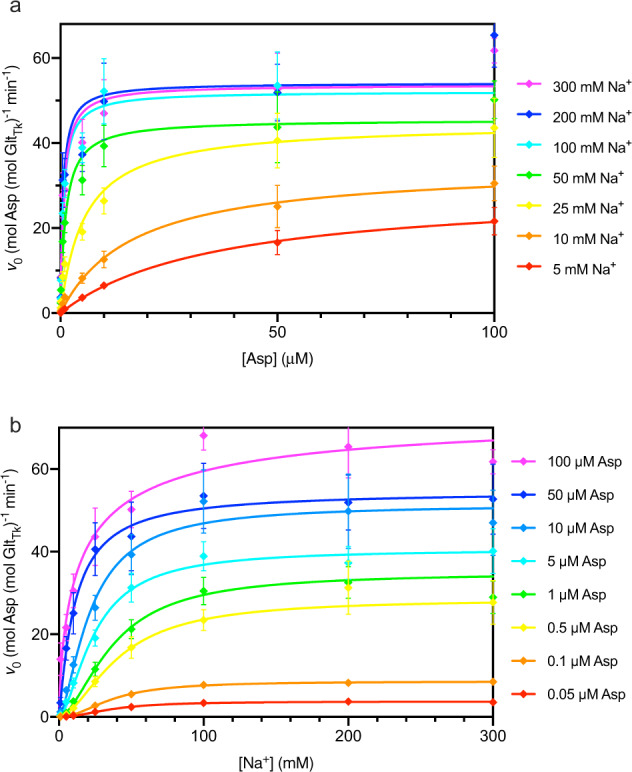
The rates represent the combined contributions of right-side-out and inside-out oriented proteins. a Aspartate-dependent measurements at different fixed Na+ concentrations. The lines represent fits of the Michaelis-Menten equation to the data for uptake at Na+ concentrations of 5 mM (red), 10 mM (orange), 25 mM (yellow), 50 mM (green), 100 mM (cyan), 200 mM (blue), 300 mM (purple). b Sodium-dependence of transport at fixed L-Asp concentrations. The lines represent fits of the Hill equation to the data for uptake at 0.05 µM (red), 0.1 µM (orange), 0.5 µM (yellow), 1 µM (green), 5 µM (cyan), 10 µM (light blue), 50 µM (blue), 100 µM (purple). Each uptake rate represents the average of three independent biological replicates, each constituted by two technical replicates, and the standard error of the mean is shown.