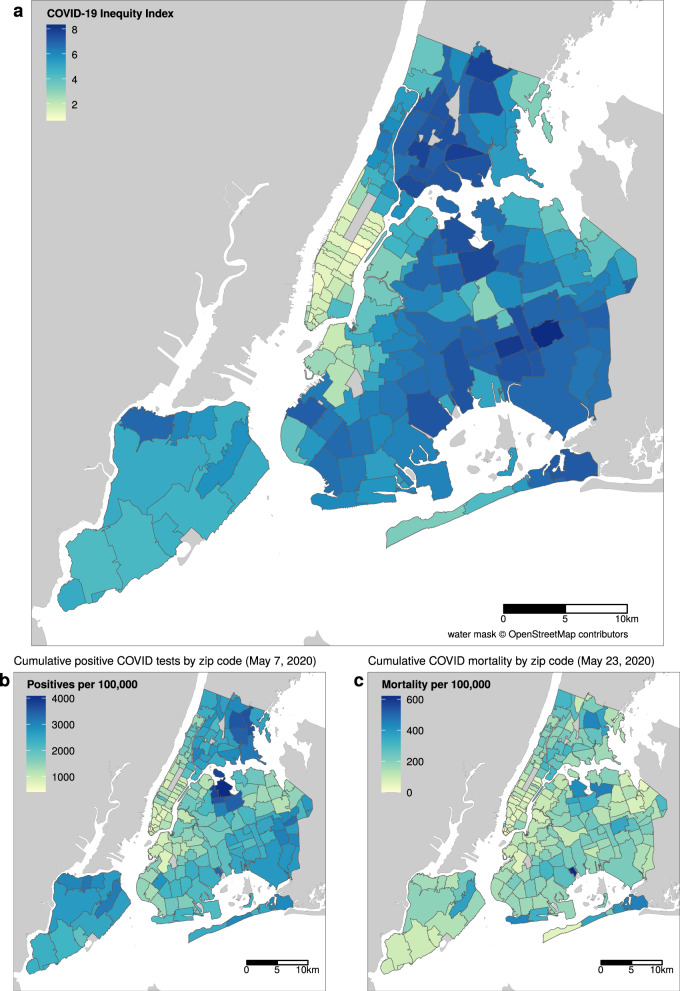
Fig. 3. COVID-19 inequity index map of NYC in relation to infections and mortality.
The unit of analysis is ZCTA (n = 177). a Shows the constructed COVID-19 inequity index based on weighted social determinants trained on (b) reported cases of SARS-Cov-2 infections as of May 7, 2020. c Shows the ZCTA-level mortality per 100,000 as of May 23, 2020. Base map and data from OpenStreetMap and OpenStreetMap Foundation. Source data are provided as a Source Data file.

