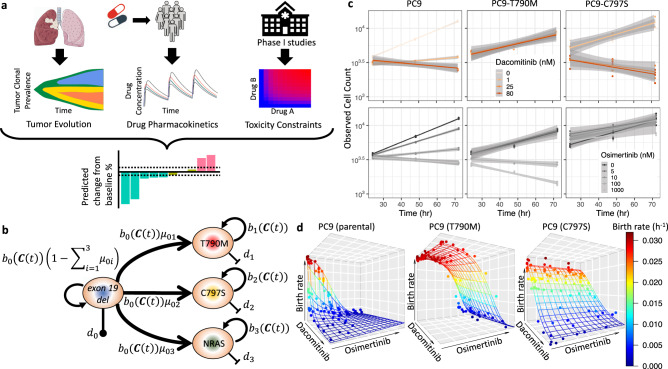
Fig. 1. Overview of the computational modeling framework and its parameterization.
a The model ensemble consists of a tumor evolution model of multiple cell types, population drug pharmacokinetic model, and toxicity constraints and can be used to identify the most favorable therapy schedules for osimertinib and dacomitinib combination treatment. The waterfall plot represents predicted patient responses for a given dosing regimen. b The tumor evolution model. Each resistance mechanism arises in a one-step process. Each cell type, , has its own drug-dependent birth rate and constant death rate, and , respectively. The drug concentrations of dacomitinib, , and osimertinib, , were modeled as a function of time . The vector of two drug concentrations, , served as the input for the multivariate birth function, . Under a particular drug-dosing schedule, the rates are therefore time-dependent. A mutation from the sensitive cell type to type occurs at rate per cell division. c Total cell counts from CellTiter Glow (CTG) experiments during osimertinib (gray-scale lines) and dacomitinib treatment (red-scale lines). The slope of each line provides the estimated growth rate for a given cell type and drug concentration. Source data are provided as a Source Data file. d Birth rates of cells during combination therapy. Points represent the estimated growth rates from c minus death rates and the contour is the predicted birth rate as a function of dacomitinib and osimertinib concentration.

