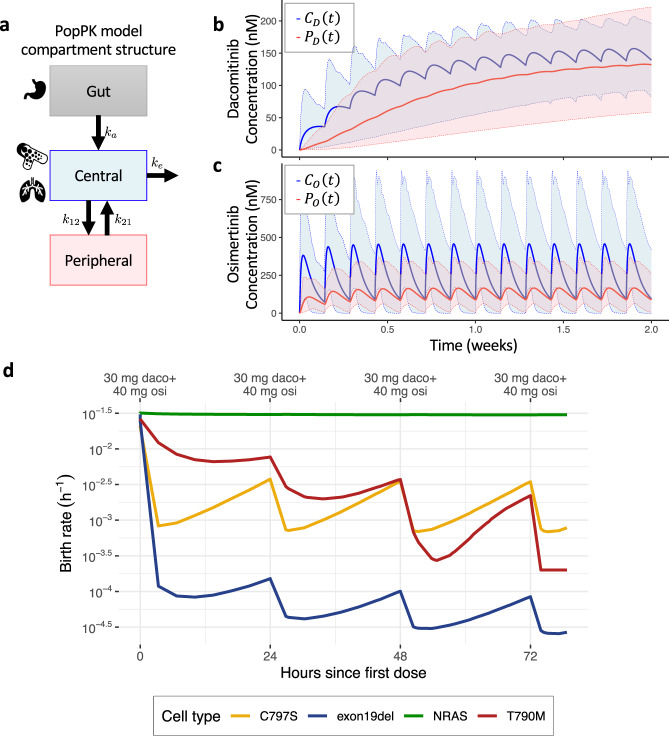
Fig. 2. Drug pharmacokinetics with inter-subject variability and effects on tumor cell fitness.
a Schematic of a two-compartment model of drug concentration over time throughout the body. Output concentrations in nanomolars from a simulation of 30 mg QD of dacomitinib (b) and 40 mg QD of osimertinib (c) in 1000 patients. Blue and red lines correspond to drug concentration in the central ( and ), and peripheral, ( and ), compartment, respectively. Solid lines are median concentrations and shaded areas represent a 95% confidence interval. d Birth rates of four cell types during dosing with 30 mg QD dacomitinib and 40 mg QD osimertinib in one simulated individual. Doses are given every 24 h starting at hour zero.

